What is a good CTR for display ads? 2026 benchmarks, costs and how to measure yours

_%2520Industry%2520Benchmarks%2520%2526%2520Optimization%2520Tips%2520(1).webp)
Click-through rate is calculated by dividing the number of clicks an ad receives by the number of times it is shown. It remains a fundamental pulse check for digital advertising campaigns, and for media buyers and performance managers it is a direct indicator of whether creative and targeting are working together.
TL;DR: Key takeaways
- The single number does not exist. The two figures in circulation come from datasets that stopped being updated eight and eleven years ago respectively. Anyone presenting either as 2026 data is republishing, not measuring.
- Format moves CTR more than vertical does—but published format benchmarks disagree with each other by up to fifteen times, so treat any specific figure with suspicion.
- Viewability, invalid traffic and made-for-advertising inventory are measured currently and rigorously. Those numbers are where a 2026 benchmark conversation should start.
- A display CTR above 1% is usually a warning, not a win. It normally means bots, a mis-tagged placement, or MFA inventory engineered to produce clicks.
- Your own 90-day baseline, segmented by format and placement, beats any industry average. There is a five-step method for building one further down.
The trouble starts when you try to compare your rate against an industry standard. Search for one and you will find a dozen articles offering a confident percentage, most of them contradicting each other, none of them citing a dataset you can inspect. This piece takes the opposite approach: it shows where each number came from, dates it, and then sets out what can actually be measured in 2026.
💡 For a broader foundation, our guide to digital display advertising covers formats, targeting and visibility in more depth.
Why you'll see two different averages: 0.05% and 0.46%
Both numbers appear on page one of Google for this query. They differ by roughly eight times. Neither article that quotes them tends to mention the other, which leaves readers to assume one is wrong. In fact both are accurate reports of what they measured—the problem is when they were measured, and what they counted.
Where 0.05% comes from
The 0.05–0.1% band traces to DoubleClick data on all display formats, collected before 2015. Smart Insights, the source most often cited for it, is refreshingly direct about this. Their page states that LocaliQ's Google Ads benchmarks now cover only the search network accounts they manage and no longer report on display at all, that Google removed the click-through rates it used to publish for DoubleClick along with its interactive display benchmarking tool, and that consequently only previous data can be presented. No alternatives are available, as far as they are aware.
That is a publisher telling readers, on the page itself, that the number is a fossil. It gets quoted anyway, usually without the surrounding paragraph.
Where 0.46% comes from
The 0.46% figure comes from WordStream's Google Ads industry benchmarks, in the edition covering 2018. That study put the average click-through rate across all industries at 3.17% for search and 0.46% for display, and it broke display down by vertical—which is where Real Estate 1.08%, Travel 0.47% and B2B 0.46% originate.
WordStream still publishes an annual benchmark study, and it remains one of the most rigorous in the industry. The 2026 edition analyzed more than 13,000 US campaigns across 23 industries running from April 2025 through March 2026. But it covers search advertising on Google Ads and Microsoft Ads only. The display network data was discontinued.
So the 2018 table is the last one WordStream produced, and it has been recirculating ever since—picked up by aggregators, restyled, given a fresh headline year, and in at least one case presented as proprietary research. If you have seen a "2026 display CTR by industry" table with Real Estate at the top around 1.08% and an overall average of 0.46%, you have seen the 2018 table.
Why the disagreement is getting worse
If the industry had quietly moved on, this would be a historical curiosity. It has not. The gap between competing figures is widening, because in the absence of a benchmark, everyone estimates.
Take native display, where four sources all claiming 2026 data give: 0.20%, a range of 0.2–0.5%, a multiple of 2.5 times the banner rate, and a range of 0.5–3%. That is a fifteen-fold spread for one metric in one year. Rich media shows the same pattern—one source has it at 0.18%, another at 1.84%, an order of magnitude apart.
Those are not measurement disagreements. They are estimates dressed as measurements. The practical consequence for a media buyer is that benchmarking against any of them tells you nothing, because a campaign performing "above average" against one is performing at a tenth of average against another.
How display CTR compares with search
The one comparison that can be made cleanly in 2026 is display against search, because the search side of the ledger is genuinely current.
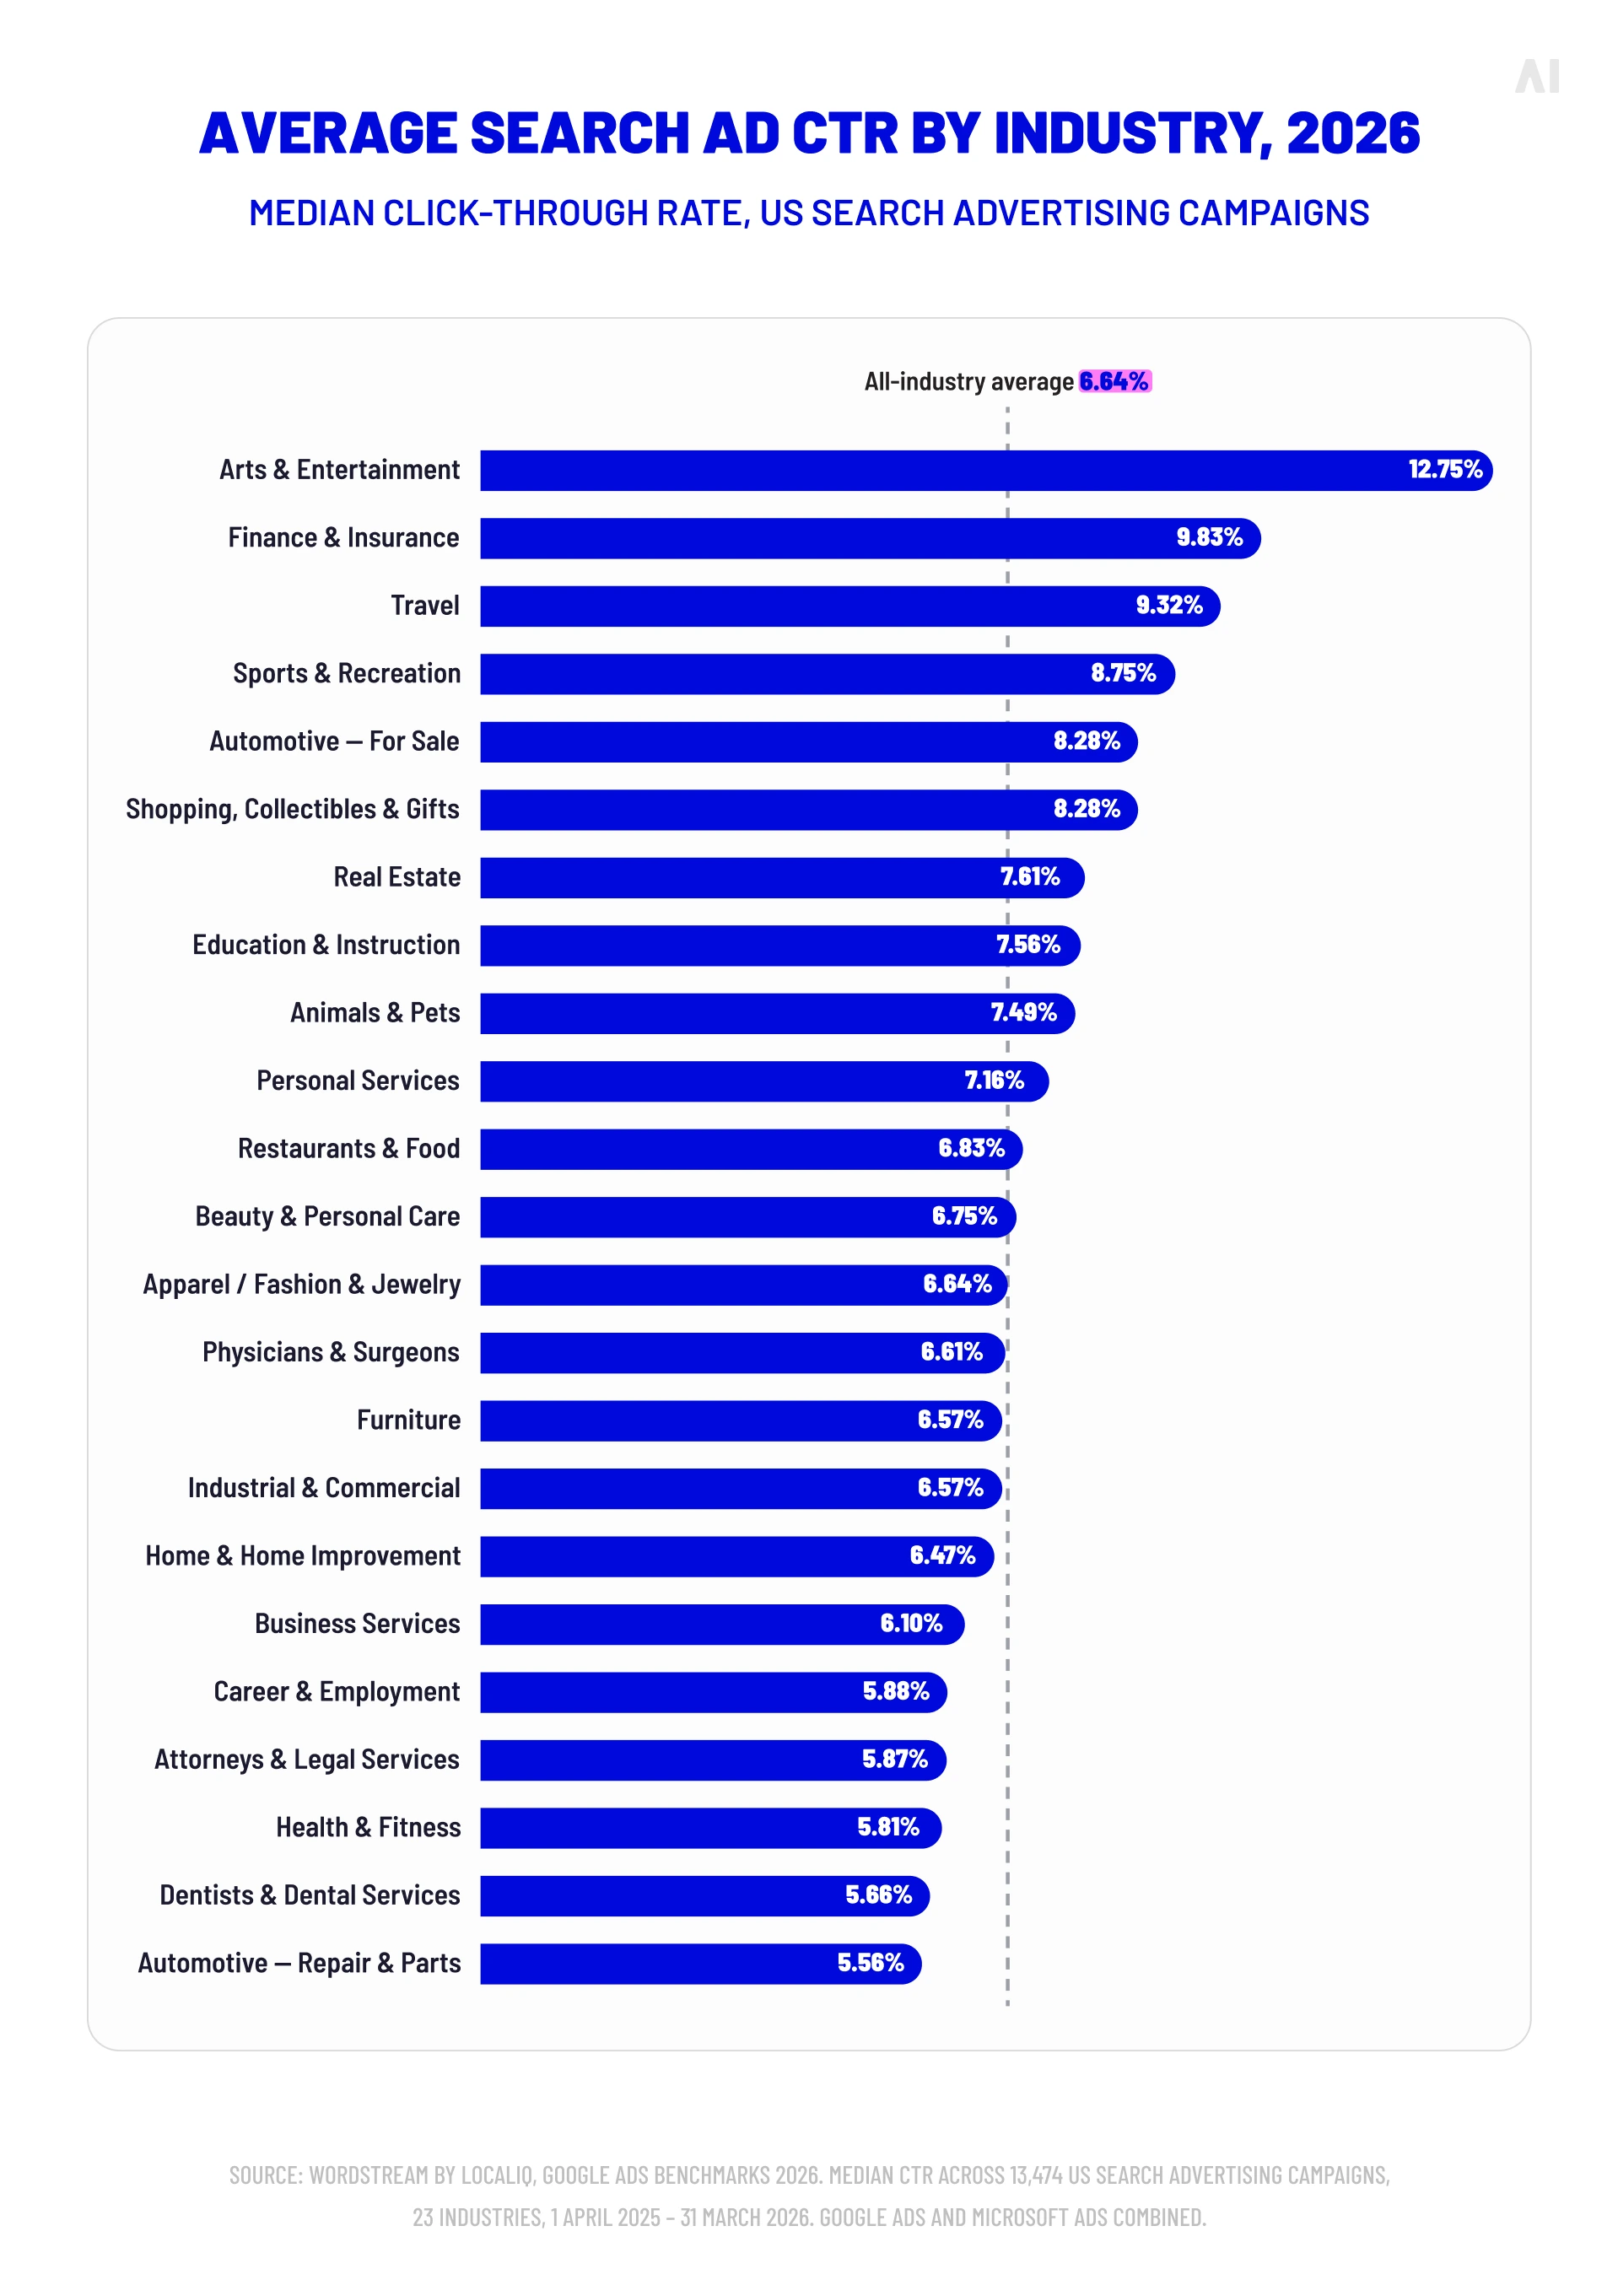
WordStream by LocaliQ's 2026 study, drawn from those 13,000-plus US campaigns, puts the average search click-through rate at 6.64%, with a $5.42 cost per click, an 8.18% conversion rate and a $66.69 cost per lead. The methodology, sample and date range are all published.
Set that beside even the most generous display estimate and the ratio is stark—search runs somewhere between ten and a hundred times higher, depending on which display figure you pick. That gap is not a display failure. It is the difference between reaching someone who typed a query and reaching someone reading an article about something else. Intent is the variable, and no amount of creative optimization closes it.
This is why cross-channel CTR comparison is the single most common benchmarking error we see. A media plan that judges display against search numbers will conclude display is broken. It is not broken; it is doing a different job.
Is a 2%, 4%, 5% or 6% CTR good?
These are the questions people actually type, so here are direct answers. Each depends entirely on which channel produced the number.
- Is a 2% CTR good? On search, it is below average and worth investigating—the 2026 cross-industry search figure is more than three times that. On social, it is respectable. On open-exchange display, 2% is not good; it is implausible. Check your tagging before you celebrate.
- Is a 4% CTR good? On search, yes—solidly above the middle of the pack in most verticals. On display, a sustained 4% is close to a mathematical impossibility outside of a tiny, heavily interactive placement. Treat it as a data problem.
- Is a 5% CTR good? Strong on search. On display, see above.
- Is a 6% CTR good? Around the search average, so respectable rather than exceptional. On display, it is a red flag of the clearest kind.
Same shape every time. On display, an unusually high CTR is more often a symptom than an achievement.
The reason is made-for-advertising inventory. MFA sites exist to generate advertising metrics, and clicks are among the metrics they are built to generate. DoubleVerify's analysis found that MFA sites may appear high-performing on isolated indicators such as clicks and viewability, precisely because they are designed to boost them—yet they deliver 7% less overall attention on display ads and 28% less on video than other media, with the most extreme sites running 25% below the attention baseline.
This is not a fringe problem. The Association of National Advertisers found that MFA sites accounted for 21% of all programmatic ad impressions and attracted 15% of total advertising spend.
So when a display campaign returns a CTR that would look normal on search, the first question is not what the creative team did right. It is where the impressions ran.
Display CTR by industry
The notion of a single good click-through rate for display ads is a myth, and industry is one reason why. User intent, purchase-cycle complexity and the nature of the product create real, substantial variation between verticals. A rate that signals a healthy campaign in one sector would prompt an investigation in another.
What has changed since this article was first published is our confidence in putting a number on each vertical. Because the underlying dataset is eight years old, the figures below are directional descriptions of how each sector behaves, not benchmarks to measure against. Where we previously published specific percentages, we have removed them rather than continue to circulate numbers we cannot source.
Retail and eCommerce
Retail is the engine of the display advertising world, characterized by enormous impression volume and a wide performance range. That range is the important part: performance is intensely fragmented. Broad upper-funnel awareness campaigns sit at the very bottom of the display range, while hyper-personalized dynamic product remarketing can run several times higher against the same brand's own baseline. The differentiator is data and personalization, which is where retail digital marketing strategy earns its keep.
The useful benchmark in retail is not an industry figure at all—it is the gap between your prospecting and your retargeting segments. If that gap is narrow, your audience data is doing less work than it should.
Finance and banking
A high-consideration sector where users researching credit cards or mortgages arrive with genuine intent. Performance is driven by trust signals, clear value propositions and targeting built on life events rather than broad demographics. Compliance constrains the creative, which makes CTR a useful read on whether an ad is cutting through consumer skepticism without resorting to overclaiming.
Healthcare and pharma
Regulatory guidelines push creative toward direct, informational executions that are rarely the most clickable. Users are also cautious with health information. CTR remains a relevant signal here, but it sits below viewability, brand lift and qualified traffic to educational content in the hierarchy of what matters. These campaigns build trust over time rather than soliciting an immediate click, and measuring them on clicks alone will consistently understate them.
Travel and hospitality
Travel runs on aspiration, and performance is heavily creative-dependent—strong destination imagery and video do most of the work. The sales cycle is long, so the campaigns that perform are typically retargeting users who have already searched for flights or accommodation. CTR here is best read as a measure of creative relevance and audience-list quality at a given journey stage.
Technology and B2B
Long, multi-touch sales cycles and committee buying produce lower click rates, and that is appropriate rather than disappointing. In B2B a click is a meaningful signal of interest from a small qualified pool. The question is not how many clicks but whose. Success is measured by whether engaged visitors from target accounts reach pages where they can be identified and nurtured.
Entertainment and media
Emotive, visually driven creative promoting releases, streaming content and events, usually with a time-bound hook. Urgency lifts engagement, and the vertical makes heavy use of rich media and video. CTR works well here as a launch-momentum indicator.
💡 For a deeper look at the tools underneath all of this, see our article on AdTech and MarTech: what's the difference and why they're converging.
CTR by ad format
Format is the single largest controllable influence on display CTR. The passive, static nature of a standard banner cannot compete with the immersive experience of a rich media or video unit, and that ordering is consistent across every dataset we examined—banners at the bottom, native above them, rich media and video above that.
What is not consistent is the size of the gaps. As noted above, published native figures span fifteen-fold and rich media tenfold. We are therefore presenting format performance as relative ordering rather than absolute percentages, with the multiples framed against your own banner baseline rather than an industry one.
{{average-ctr-1}}
One detail in that table is worth more than the numbers themselves. On rich media, sources that disagree about the absolute rate by a factor of ten—one puts it at 0.18%, another at 1.84%—nonetheless converge on roughly the same multiple against banner. They are measuring different inventory, different geographies and different campaign mixes, but the relationship between formats holds steady across all of them.
For creative planning, that makes your own banner line the reference point. Set rich media against it, native against it, video against it—the multiples survive the differences in inventory and measurement that push the absolute rates around.
💡 For a detailed comparison to guide your planning, explore our breakdown of native ads vs display ads, including key differences, examples and when to use each. If you are evaluating suppliers, our rundown of the best native ads platforms covers the demand side in more detail.
CTR by device
Device shapes engagement through screen size, user context and intent. It also shapes something more measurable than CTR, and more consequential: whether the ad is seen at all.
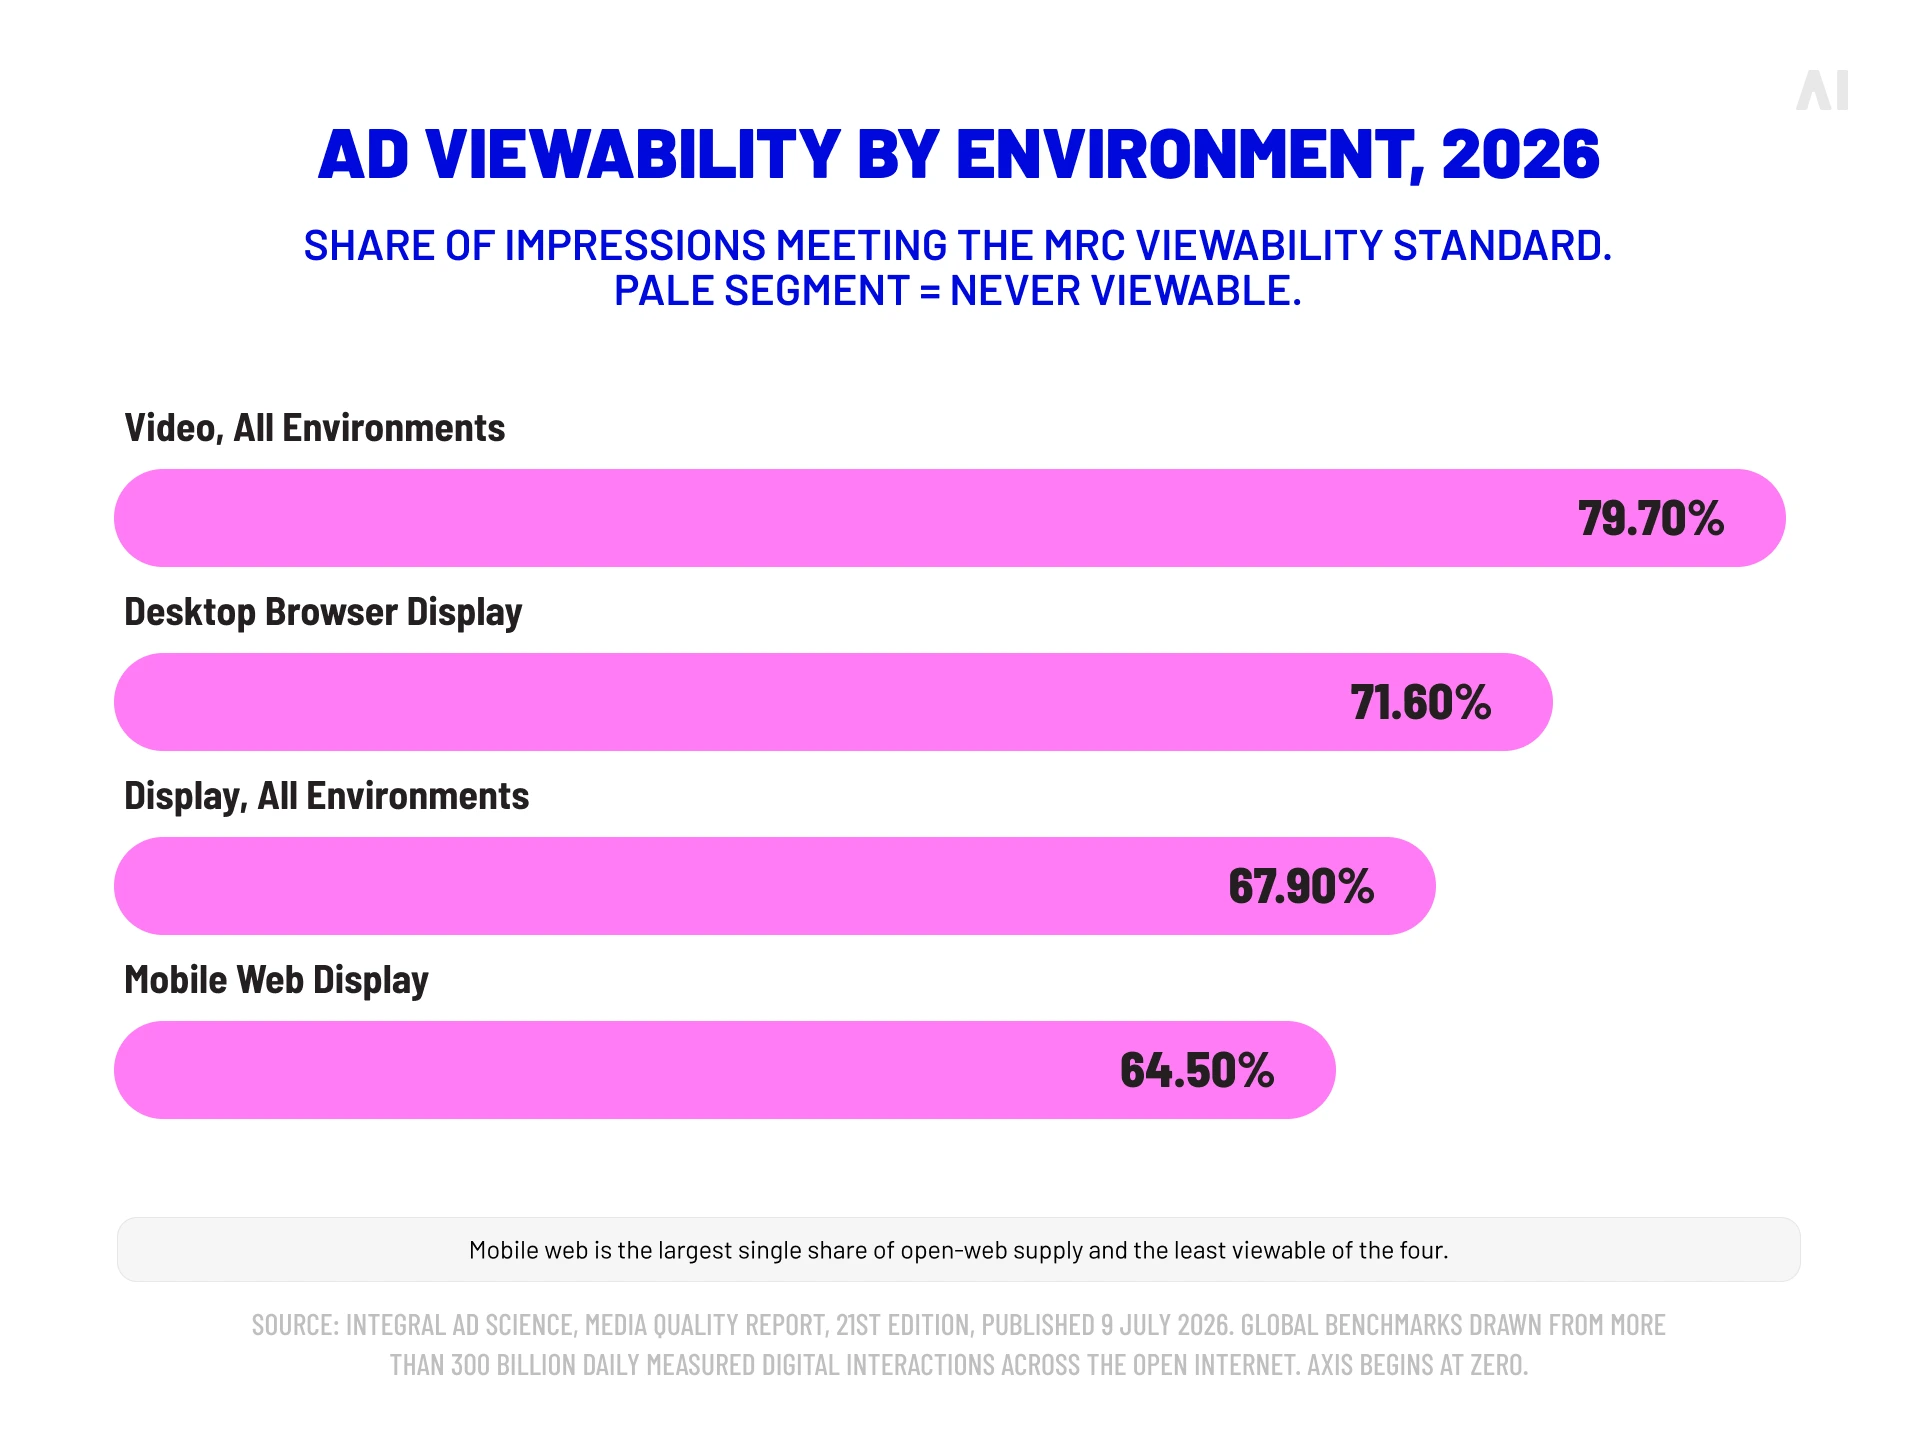
Integral Ad Science's 21st Media Quality Report, published in July 2026, found desktop browser display running at 71.6% viewability against 64.5% for mobile web display—a seven-point deficit for the environment that carries the most impressions.
That gap matters more than any device-level CTR estimate, because it is upstream of the click. A third of mobile web display impressions are never seen. Any CTR calculated across them is diluted by inventory that never had a chance to perform, which is one reason device-level click comparisons are so unstable across datasets.
The more useful question is not what CTR each environment produces, but what a CTR from each environment actually means.
{{average-ctr-2}}
The pattern across all four is that environment determines what the metric is worth. A single blended device-level CTR averages together four numbers that mean four different things, which is why it moves unpredictably and why it should not drive optimization decisions on its own.
Viewability benchmarks 2026
An unseen ad cannot be clicked. The article has always made that argument; here are the numbers behind it.
IAS's 21st Media Quality Report analyzed more than 300 billion daily digital interactions across the open internet, and put global display viewability at 67.9% against 79.7% for video—a gap of 11.8 percentage points that has widened into a structural feature of the market rather than a temporary divergence.
Read that display figure carefully. Roughly a third of display impressions bought across the open internet are not viewable by the MRC standard. Before any conversation about creative or targeting, a third of the media is doing nothing at all.
This is the benchmark we would encourage clients to adopt in place of an industry CTR figure. Viewability is measured continuously, by independent verification vendors, with published methodology and sample sizes. It is the closest thing display has to a reliable yardstick, and unlike a CTR average it points directly at something you can fix.
Platform and supply comparison
Where your ads run affects performance more than almost any other planning decision. The same creative, audience and budget will produce materially different results across the Google Display Network, the open programmatic exchange, private marketplace deals, native placements and CTV.
The differences are not primarily about click rates. They are about how much of what you buy is real.
Mobile web: the largest and the least clean
IAS found that mobile web display carries a made-for-advertising rate four times higher than desktop—2.0% against 0.5%. The scale is what makes this urgent: mobile web accounts for 45.1% of all open-web impressions IAS measured.
The largest single slice of programmatic supply is also its dirtiest. That combination explains a great deal about why open-exchange display underperforms and why the CTR figures attached to it are so unreliable. It also points to the fix, which is not to abandon mobile web—it is far too large for that—but to filter it at page level with maintained exclusion lists.
CTV: either very clean or very dirty
CTV is where the spread between verified and unverified buying is widest. IAS found non-optimized CTV campaigns running 9.1% invalid traffic in 2025, against 0.1% for optimized campaigns.
That is a roughly ninetyfold difference between the same channel bought two ways. CTV without verification is the riskiest line on a 2026 media plan, and the risk is rising: DoubleVerify recorded a 140% increase in CTV fraud schemes in the first quarter of 2026. Buyer confidence reflects it—an IAB survey in July 2026 found only a third of marketers fully trust platform-reported performance claims.
{{average-ctr-3}}
Programmatic buying is the engine of modern display, and the demand-side platform is its control center. Rather than negotiating ad space manually, media buyers access ad impressions across millions of placements through a single interface.
💡 For a fuller picture of how the pieces fit, our guide to programmatic advertising covers the ecosystem, and our analysis of the value proposition of DSPs covers where that model is heading.
What display costs in 2026—and why CPM benchmarks disagree too
CPM benchmarks have the same problem as CTR benchmarks, and comparing two sources side by side makes the mechanism obvious.
DataBeat's US Programmatic Trends Report, distributed in August 2026 and covering June, draws on partner data spanning more than $55 million in monthly revenue, over 35 billion monthly impressions and signals from more than 200 tracked bidders. It puts web display CPM at $1.42, app at $1.70, AMP at $1.01 and CTV at $5.74. Mobile and desktop have almost converged, at $1.72 and $1.77 respectively.
Widely circulated advertiser-side estimates for the same period put open exchange near $5.85 and CTV above $24. That is a four-fold discrepancy on CTV.
Both can be right. DataBeat measures realized CPMs on the sell side—what publishers actually received for matched impressions. Rate-card estimates describe what a buyer expects to pay including DSP fees, data costs and the margin stack in between. Neither is wrong; they are counting different money at different points in the chain.
The lesson is the same one that governs the CTR question. Before comparing your number to a benchmark, establish what the benchmark counted. A CPM quoted without a measurement point is as useless as a CTR quoted without a channel.
The directional signal from the same report is worth planning around: overall CPMs rose 16.9% month over month and 51.0% year over year, while programmatic fill rate moved just 1.6% annually. The price of a matched impression climbed sharply; the proportion of impressions finding a buyer barely moved. Budgets set against 2025 costs will buy meaningfully less inventory in 2026.
Part of that price pressure is manufactured. DataBeat's companion sellers report found tier-one supply-side platforms still running a 46% duplicated-domain rate, with 56.9% of new supply relationships forming through resellers rather than direct integrations. When the same publisher domain is reachable through several paths, the same impression can enter the bidstream twice and bid against itself.
This is the case for supply-path optimization stated in numbers rather than principle.
💡 For the underlying metrics, see our guide to CPM vs CPC vs CPA.
Key factors influencing CTR
While benchmarks provide a target, your actual display ad CTR is determined by a complex interplay of strategic and tactical factors. A high click-through rate is not accidental; it is the result of orchestrating several elements, from the technical quality of the impression to the emotional pull of the creative.
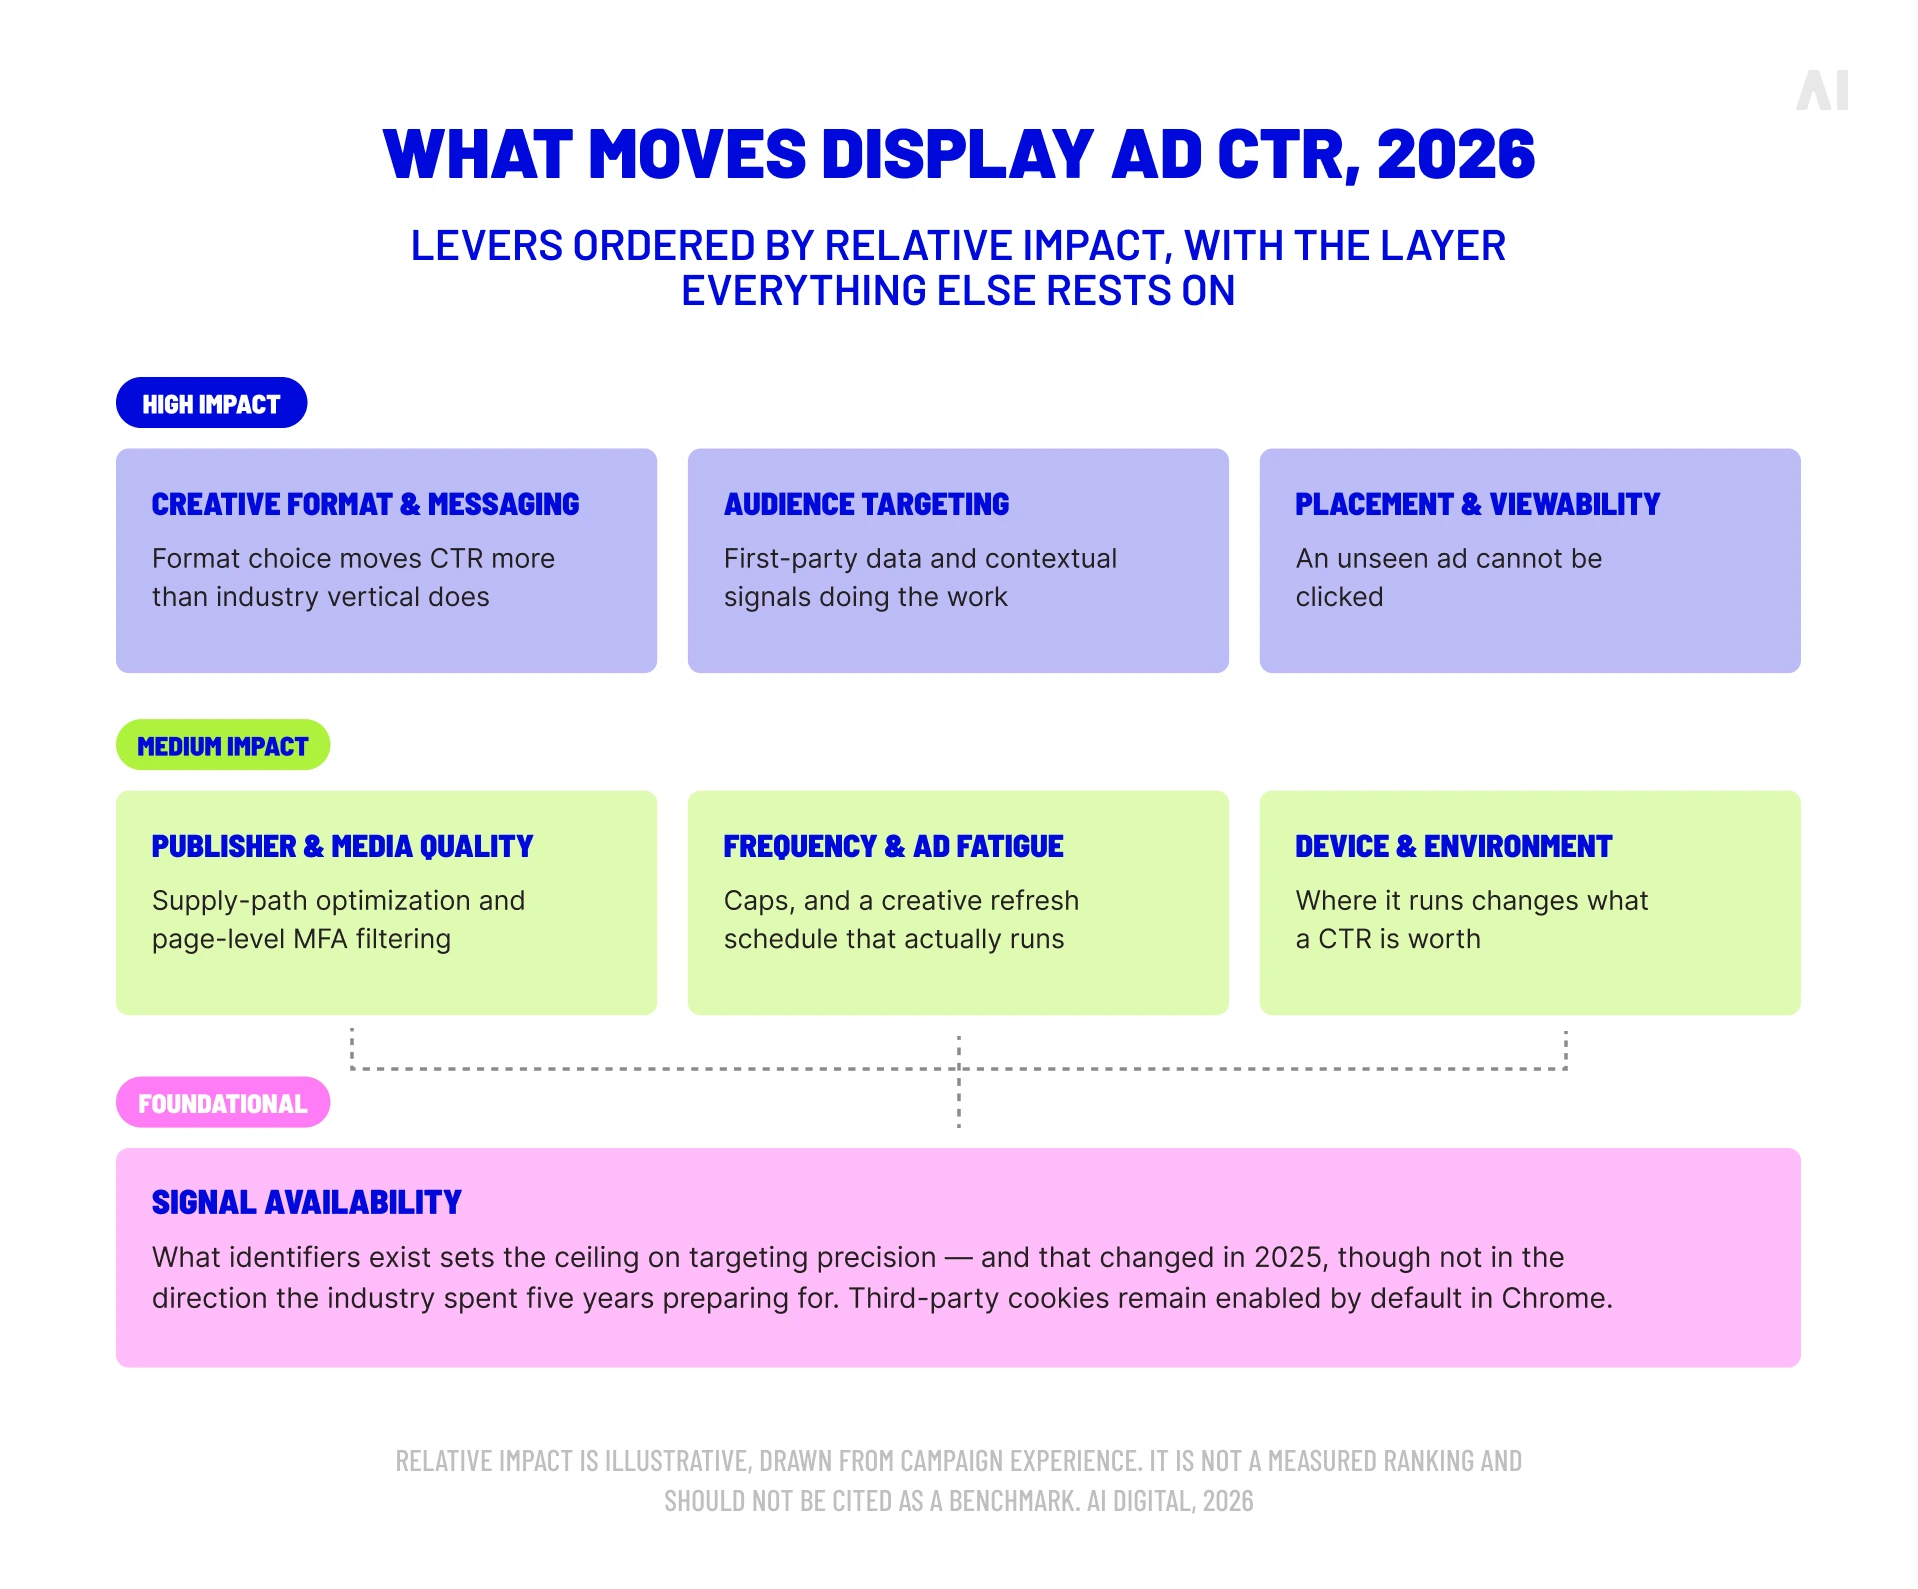
- Creative format and messaging (high impact). Your most powerful lever. A static banner will deliver a different average click-through rate for banner ads than an interactive rich media unit. Compelling, value-oriented messaging with a clear call to action is non-negotiable, and dynamic creative optimization powered by AI can tailor messages in real time to lift relevance.
- Audience targeting and relevance (high impact). Showing the right ad to the right person remains the cornerstone of performance. First-party data, contextual targeting and predictive audiences are the durable approaches—for reasons covered in the next section, which are not the ones the industry spent five years expecting.
- Ad placement and viewability (high impact). An unseen ad cannot be clicked. Viewability is a direct prerequisite for CTR, and placements above the fold, within content and on high-engagement sites naturally yield stronger display ad metrics.
- Publisher and media quality (medium impact). The environment matters. Ads placed on reputable, brand-safe sites through supply-path optimization generate more trust and engagement than those on cluttered, low-quality inventory. Investing in fraud-free premium supply protects the brand and improves the performance of the impressions you do buy.
- Frequency and ad fatigue (medium impact). Even strong creative wears out. Oversaturating a user with the same ad produces banner blindness and a sharp decline in CTR. Frequency caps and a genuine creative refresh schedule are what keep a campaign effective over its full flight.
- Device and environment (medium impact). User behavior differs by device, and so does the inventory quality underneath it. A mobile-optimized ad with a thumb-friendly CTA is a different proposition from a desktop skyscraper, and as the viewability data shows, the two environments are not equally clean.
- Signal availability (foundational impact). Targeting precision depends on what identifiers are available, and that has changed—though not in the direction most of the industry planned for.
What actually changed: cookies stayed, Privacy Sandbox died
For five years, almost every article on display advertising—including earlier versions of this one—was written on the assumption that third-party cookies were being phased out of Chrome and that Google's Privacy Sandbox would replace them. Neither happened.
On 22 April 2025, Google dropped its fallback plan for a standalone cookie choice prompt in Chrome. Then on 17 October 2025, the UK's Competition and Markets Authority released Google from its Sandbox-related commitments, and Google announced on the same day that it had decided to retire the bulk of the Privacy Sandbox technologies.
Three narrower pieces survived—CHIPS, FedCM and Private State Tokens—and Google said it would pursue an interoperable attribution standard through the W3C rather than through Sandbox. Deprecation landed in Chrome 144 in January 2026, with removal targeted for Chrome 150 in July 2026.
Third-party cookies remain enabled by default in Chrome, with no announced timeline for removal.
This matters for two reasons.
- The first is practical: if you built a 2025 media plan around Sandbox APIs, those APIs are gone, and the fallback you were told to prepare for is not needed.
- The second is editorial. A large proportion of the display advertising content currently ranking on Google—including several articles that outrank this one—still describes the cookieless era as an ongoing transition. It is not. It was called off.
The strategic conclusion most of those articles reach is nonetheless correct, for different reasons. First-party data, contextual targeting and AI-driven prediction are becoming more important, but the pressure comes from Safari and Firefox, which have blocked third-party cookies for years; from mobile app environments where cookies never applied; from regulation in the EU, UK and a growing number of US states; and from general signal degradation. It does not come from Chrome. Getting the reasoning right matters, because the mitigations differ depending on which pressure you are responding to.
💡 To understand how machine learning is shaping targeting in this environment, see our work on AI in digital marketing and AI targeted advertising.
What else is changing in 2026
Three further shifts are worth tracking, and the first changes how display gets bought at all.
Google is retiring the standalone Display campaign
The campaign type that produced the industry's last display benchmark is itself being withdrawn. In May 2026 Google announced that Google Display Ads campaigns are moving into Demand Gen, which spans YouTube, Discover, Gmail and Maps alongside the Display Network's roughly two million sites, videos and apps.
The network is not going anywhere; the way you buy it is. Google's timeline put a migration tool into accounts from June 2026, after which new standalone Display campaigns can no longer be created, with remaining campaigns migrated automatically at a date Google has not yet named. Advertisers who use the migration tool carry across 42 days of performance history, which keeps the learning period to a day or two rather than restarting cold.
Two consequences matter for anyone benchmarking display.
- First, migrated campaigns have the Display Network opted in by default and cannot opt out during migration, so inventory mix changes underneath you unless you adjust afterward.
- Second, exclusion lists do not reliably survive the move, and the Demand Gen inventory pool is wider than the one you were excluding against. Rebuild and verify them. Given what the MFA and viewability data shows about unmanaged supply, an exclusion list that silently fails to carry over is an expensive thing to discover late.
Google reports that advertisers adding the Display Network to Demand Gen campaigns see an average 9.5% increase in ROI. That is the platform's own figure for its own migration, so treat it as a directional claim rather than an independent finding—which is, in miniature, the argument this whole article has been making.
Creative is becoming a targeting variable
As deterministic identifiers thin out, the creative itself carries more of the targeting load. Dynamic creative optimization and generative asset production let a single campaign address many contexts, which changes what a CTR test is actually measuring: less "did this ad work" and more "which combination worked for whom." Segment accordingly, or the average will hide the finding.
Retail media and CTV keep absorbing display budgets
Both channels are taking share from open-web display, and both bring measurement conditions worth understanding before you compare click rates across them. Retail media sits behind closed reporting; CTV, as the invalid-traffic figures above show, splits sharply between verified and unverified buying.
💡 For more on the latter, see our guide to CTV retargeting and our overview of top display ad networks.
CTR vs other performance metrics
CTR is a vital sign of initial engagement, and one data point in a full campaign health assessment. Relying on it alone tells you something caught attention, but not whether the story was worthwhile.
- CTR vs viewability. A high viewability rate means your ad had the opportunity to be seen; a high CTR means it was compelling enough to act on. They are complementary. High viewability with low CTR usually points to creative or targeting problems. High CTR with low viewability suggests budget going to fraudulent or poorly placed impressions.
- CTR vs conversion rate. The most important comparison. CTR measures the top-of-funnel click; CVR measures the action that follows. A strong CTR with a weak conversion rate indicates a disconnect—misleading creative, a poor landing page experience, or low-intent clicks.
- CTR vs cost per acquisition and return on ad spend. A campaign with a modest CTR can be highly profitable if it converts efficiently. A campaign with a high CTR that fails to convert is inefficient regardless of how it compares to any benchmark.
- CTR vs post-click engagement. Bounce rate, pages per session and session duration reveal the quality of the traffic your ads drive. High CTR alongside high bounce rate suggests the ad is relevant but the landing page is not—or that you are attracting the wrong audience entirely.
CTR is an excellent diagnostic tool for creative effectiveness and initial audience relevance. It answers the question: is my ad compelling people to take the first step? It should not be optimized in isolation. The goal is not to maximize CTR but to find the range where a strong click rate works alongside strong conversion, acceptable CPA and positive ROAS.
💡 For a fuller view of what to track, see our guide to essential digital marketing KPIs.
How to benchmark your own campaign in five steps
Given that no reliable industry benchmark exists, the only defensible comparison is against yourself. Here is the method we use.
- Segment before you compare. A blended campaign CTR is close to meaningless. Split by format, placement type, device and funnel stage before you look at a single number. A campaign averaging 0.12% might be a 0.4% native line pulling up a 0.03% banner line—two entirely different diagnoses, invisible in the average.
- Strip out invalid traffic and MFA inventory. Run your reporting on verified impressions only. Given what the MFA data shows about engineered clicks, an unfiltered CTR is measuring your exposure to bad inventory as much as your creative.
- Build a 90-day baseline. Take a rolling quarter of clean, segmented data and treat it as your reference. Ninety days smooths out seasonality and creative refresh cycles while staying recent enough to reflect current market conditions.
- Normalize for viewability. Calculate CTR against viewable impressions, not served impressions. With roughly a third of open-internet display never seen, the two figures diverge substantially, and only the viewable-based number tells you anything about creative performance.
- Compare direction, not level. Ask whether this month beat last month on comparable inventory, and whether a change you made moved it. That question is answerable. "Are we above the industry average" is not.
The prize for doing this properly is not a tidier dashboard. IAS found that campaigns activating attention-based strategies recorded a 56% increase in attention scores alongside a 76% decline in cost per click, with household-level sales lift running up to 313% higher for high-attention video placements. Measuring the right thing changes what you buy, and buying differently changes the outcome.
How to improve CTR for display ads
A low display CTR is a solvable problem. Moving from average to strong requires a disciplined test-and-learn approach across audience, creative and placement.
- Test and optimize creative: Your creative is the most powerful tool available for improving display performance. Even excellent targeting will fail behind a weak ad.
- Use contextual and AI targeting: With signal availability changing for the reasons set out above, the durable approach combines contextual intelligence with predictive modeling.
AI targeted advertising moves beyond static audience segments and one-dimensional contextual signals. Machine learning models analyze browsing behavior, content engagement, purchase-intent signals and situational context in real time to predict which user is most likely to engage with a specific creative at a specific moment.
- Use dynamic creative and personalization: Generic ads get generic results. Dynamic content personalization automatically tailors headlines, visuals and CTAs to each user based on behavior, intent or context.
- Improve placement through programmatic and Smart Supply: Where your ad appears is almost as important as what it says. A well-targeted ad on low-quality inventory will fail, and the viewability and MFA data above explains exactly why.
- Monitor performance and iterate: Optimization is a continuous cycle rather than a one-time task. The market, your audience and creative fatigue all move.
💡 For the wider planning context, see our guide to media planning and buying, and our overview of programmatic display advertising across the open internet.
How Smart Supply improves CTR and performance
Even compelling creative will fail if it is served in the wrong place, at the wrong time, or to something that is not a person. This is where the quality of your media supply becomes the foundation for everything else—a point the data throughout this article keeps returning to.
Smart Supply applies machine learning and supply-path optimization to the programmatic supply chain:
- Eliminating fraudulent and low-quality inventory. By filtering out invalid traffic and made-for-advertising sites, Smart Supply directs budget toward real, viewable impressions with a genuine chance to engage users. Given that MFA represents a fifth of programmatic impressions, this is a substantial recovery of wasted spend.
- Prioritizing high-engagement placements. Supply selection and optimization favor publisher environments and placements with a proven record of viewability and interaction, so ads are more likely to be seen—and a seen ad is a clickable ad.
- Optimizing for efficiency and outcomes. Streamlining the path to premium inventory reduces waste, including the duplicated supply paths that inflate CPMs without adding reach. The freed budget moves to more valuable impressions.
The result is a virtuous cycle: cleaner inventory leads to higher viewability, which creates more opportunities for engagement, which drives a stronger click-through rate and more efficient conversions.
Alongside it, Elevate is our vendor-agnostic marketing intelligence platform, covering research, planning, optimization and reporting across more than twelve DSPs. For benchmarking work of the kind described above, that cross-platform view is the difference between comparing your campaign to a number you found on the internet and comparing it to comparable inventory you actually bought.
💡See how Elevate approaches transparent media intelligence for more, and our PubMatic case study for supply optimization in practice.
Conclusion: the role of CTR in 2026
CTR's place on the dashboard is secure, but its status has changed. It is not a standalone success metric; it is a diagnostic—a leading indicator of creative resonance and audience relevance, most useful when read against viewability, conversion rate, CPA and ROAS together.
What has changed more is our ability to benchmark it externally. That capability has quietly disappeared, and much of the industry has not noticed, which is why two incompatible averages continue to circulate as current fact. The honest position is that display CTR now has to be measured internally, against clean and segmented data, or not meaningfully measured at all.
Your actionable takeaways for 2026:
- Verify any benchmark before you plan against it. Ask who measured it, when, and what they counted. If a source cannot answer those three questions, the number is decoration. This applies to CPM as much as to CTR.
- Prioritize quality impressions over cheap clicks. With a third of open-internet display never viewable and a fifth of programmatic impressions running on MFA inventory, supply quality is the largest single lever available. Premium, brand-safe, high-viewability environments give creative a genuine chance to work.
- Build your own baseline and defend it. Segment, filter, normalize for viewability and measure direction over ninety days. It is more work than quoting an industry average, and it is the only version that will survive scrutiny in a QBR.
- Treat an unusually high display CTR as a question, not an answer. Investigate before you scale.
If you'd like a second pair of eyes on your display baseline—what your inventory mix is really costing you, and which of your numbers will hold up—get in touch.