15 Essential Digital Marketing KPIs to Track (and Improve) in 2026

%2520in%25202026.webp)
Ask most marketing teams for data and you'll get more than you bargained for. What you won't always get is a straight answer to the only question that counts, which is whether any of it is making the company money. The measuring was never the difficult part. Working out which figures actually prove your work is earning its keep — that's where teams come unstuck.
It's also where the ones pulling ahead separate themselves. Today 83% of marketing leaders put proving ROI at the top of their priorities, up from 68% five years ago, and yet only 36% believe they can measure it with any accuracy. Budgets are won and lost in the gap between those two numbers.
Getting it right begins with knowing which figures deserve your trust. Page views, followers, email opens — useful readouts, but readouts all the same. A digital marketing KPI is something sturdier: one of the handful of measurements roped directly to revenue, growth, or retention.
An AI-powered approach pulls its weight precisely here. Elevate, AI Digital's marketing intelligence platform, unifies your data across 12+ DSPs and every channel you run, then uses AI-assisted planning, media mix modeling, and path-to-conversion analysis to show where your budget is actually working. The point is putting a clear, cross-channel read on performance in front of the person making the call. The habit rewards you fast, too: marketers who measure ROI consistently are 1.6x more likely to walk away with bigger budgets.
The 15 KPIs below are the ones worth your attention in 2026. For each, you'll find what it actually tells you, a realistic benchmark to hold it against, and how to move it from a figure on a screen to a decision you're willing to make.
TL;DR
- A KPI is a metric roped to revenue, growth, or retention — the rest is vanity.
- Track a focused 5–8 chosen around your campaign goal, not all 15 at once.
- Benchmarks (roughly a 7.5% paid-search conversion rate, a +32 average NPS) are directional — judge every number against your own baseline.
- Attribution quality sits underneath all of it: bad data quietly corrupts every other KPI.

What Are Digital Marketing KPIs (And Why Do They Matter)?
Simply put, KPIs for digital marketing are a select set of quantifiable measurements used to gauge a company's long-term performance in achieving its key marketing objectives. They are the vital signs of your strategy, distinct from the broader category of digital marketing metrics.
While all key performance indicators are metrics, not all digital marketing metrics qualify as KPIs. The critical difference is alignment: true marketing performance indicators are explicitly tied to core business goals like revenue growth, market share, and customer retention. They answer the "so what?" behind the data. For instance, a social media "like" is a metric; the conversion rate of social media visitors into email subscribers is a KPI.
This distinction is crucial for any team because it forces strategic clarity. Digital marketing KPIs directly connect daily activities to big-picture outcomes. They are the engine that allows you to measure marketing ROI accurately.
Vanity Metrics vs. Real KPIs
One of the most critical skills in data-driven marketing is learning to separate the signal from the noise. This is the fundamental battle between vanity metrics and real key marketing metrics.
Vanity metrics are surface-level numbers that look impressive on paper but offer little insight into your business's health or growth. They are often passive and easily inflated. Examples include raw page views, social media followers, or email open rates (without context). While they might boost team morale, they don't inform strategy or prove ROI.
In contrast, real digital marketing KPIs are action-oriented and tied directly to business objectives. They are the key performance indicators that reveal efficiency, impact, and potential. For example:
- Instead of "Page Views," a real KPI for digital marketing is "Conversion Rate on Key Landing Pages."
- Instead of "Social Media Followers," a real online marketing KPI is "Lead Generation Rate from Social Channels."
- Instead of "Email Opens," a real internet marketing metric is "Revenue Per Email Subscriber."

These marketing KPI examples show a direct line to business outcomes. Advertising metrics and KPIs like Cost Per Acquisition (CPA) and Return on Ad Spend (ROAS) are prime examples of this—they directly measure the financial efficiency of your digital advertising metrics.
This is the thinking behind Elevate. Its reporting is built to foreground the metrics roped to revenue and push the vanity numbers where they belong — out of the way. So when your team sits down to read the week, the conversation starts with the figures that predict growth rather than the ones that only flatter it.
The 15 essential KPIs at a glance
Before the deep dive, here is the full list in one scannable view. Formula, what each KPI measures, and a realistic 2026 benchmark — with the important caveat that benchmarks are directional and vary by channel, industry, and how you define a conversion.
{{dmkpi-1}}
The 15 essential KPIs every marketer should track in 2026
Moving beyond theory, this section delivers an actionable list of the most critical key performance indicators. For each KPI, you will find a clear explanation of what it measures, why it's a key marketing metric for 2026, and — crucially — how an AI-powered approach transforms it from a simple data point into a predictive tool for growth.
1. Brand awareness
Brand awareness quantifies the extent to which your target audience is familiar with and recognizes your brand. It measures the visibility and mental "market share" your brand holds, typically tracked through metrics like share of voice, branded search volume, and direct website traffic.
While a top-funnel metric, strong brand awareness is a powerful performance driver. It builds crucial trust, creates brand affinity, and makes all subsequent marketing efforts more effective and cost-efficient.
A recognized brand commands higher click-through rates, lowers customer acquisition cost (CAC), and establishes a defensible market position against competitors.
{{dmkpi-2}}
While crucial, brand awareness should be analyzed alongside mid-funnel and bottom-funnel marketing KPIs to fully understand its impact on the customer journey and revenue.
2. Engagement rate
Engagement rate measures the level of active interaction and involvement your audience has with your content or campaigns. It goes beyond passive views to quantify actions like clicks, likes, shares, comments, and time spent. In platforms like GA4, it's a core metric that combines engaged sessions, engagement time, and engagement rate per session.
The most common formula for social media and general content is:
Engagement Rate = (Total Engagements ÷ Total Reach) × 100
How to improve it? Use first-party data and AI-driven insights to segment your audience and deliver hyper-relevant content. Personalization dramatically increases the likelihood of interaction.
💡 For deeper insight on reaching engaged audiences in a high-attention environment, explore Streaming TV Advertising, which uses these very principles at scale.
3. Click-through rate (CTR)
Click-through rate (CTR) is a fundamental digital advertising metric that measures the percentage of people who click on your ad after seeing it. It is a direct indicator of how relevant and compelling your ad creative and targeting are to your audience.
The formula for calculating CTR is:
CTR = (Total Clicks ÷ Total Impressions) × 100
A high CTR is critical for campaign success. It not only drives traffic but also signals to advertising platforms that your ad is high-quality and relevant. This leads to lower cost per click (CPC) and better ad placements, maximizing your return on ad spend (ROAS). A low CTR indicates that your message isn't resonating with the audience you're targeting.
How to improve it? Improving your CTR is a function of refining two key areas: creative and targeting.
- Use strong, action-oriented copy, compelling visuals, and clear, value-driven calls to action. A/B test different headlines and images to see what resonates most.
- Use first-party data and audience insights to ensure your ads are shown to users who are most likely to be interested in your offer.
💡 For a deep dive into industry benchmarks and advanced strategies to boost your performance, read our full guide: Average CTR for Display Ads.
4. Bounce rate and dwell time
Bounce rate is the percentage of visitors who land on a page and leave without taking any further action (like clicking to another page). Dwell time measures how long a user spends on a page before returning to the search results:
- Bounce Rate Formula: (Single-page sessions ÷ Total sessions) × 100
- Dwell Time: Calculated automatically by analytics platforms like GA4.
These are critical GA4 metrics for understanding content quality and user intent.
- A high bounce rate and low dwell time often signal that your page isn't relevant to the visitor or the search query.
- Conversely, a low bounce rate and high dwell time indicate engaged users — a positive ranking signal for SEO and a sign of effective messaging.
5. Conversion rate (CVR)
Conversion rate (CVR) is the percentage of users who complete a desired action (a "conversion") out of the total number of visitors. A conversion can be a purchase, a form submission, a phone call, or any other valuable goal.
The formula is:
CVR = (Total Number of Conversions ÷ Total Number of Visitors) × 100
Conversion rate is the ultimate test of your message-market fit and user experience. Improving your CVR is the most efficient way to increase ROI without spending more on traffic.
6. Cost per lead (CPL)
Cost per lead (CPL) is a digital advertising metric that measures the average cost to acquire a new lead (e.g., someone who fills out a contact form or signs up for a newsletter).
The formula is:
CPL = Total Ad Spend ÷ Total Number of Leads Generated
CPL is essential for evaluating the efficiency of your top-of-funnel and middle-of-funnel marketing activities. It lets you compare the cost-effectiveness of different channels and campaigns in generating potential customer contacts, helping you optimize your budget for lead generation.
7. Cost per acquisition (CPA)
Cost per acquisition (CPA), also known as cost per action or cost per purchase, measures the average cost to acquire one paying customer. It is a cornerstone KPI for digital marketing.
The formula is:
CPA = Total Campaign Cost ÷ Total Number of Customers Acquired
While CPL measures the cost of a lead, CPA measures the cost of an actual customer. This is the ultimate metric for evaluating campaign profitability and marketing ROI. It tells you exactly what you're paying to earn revenue, making it critical for scaling your business sustainably.
8. Return on ad spend (ROAS)
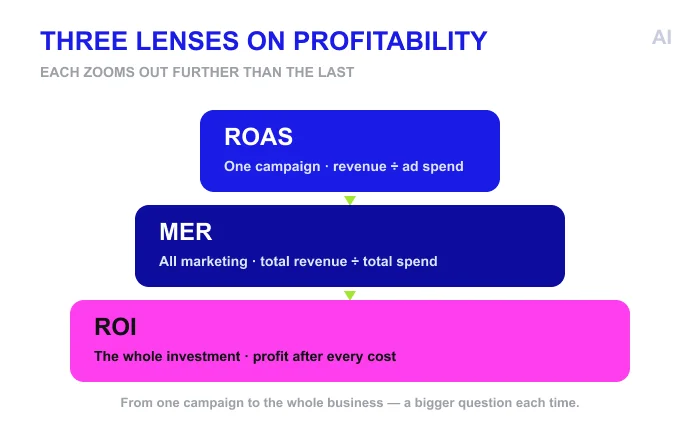
Return on ad spend (ROAS) is a crucial digital advertising metric that measures the revenue generated for every dollar spent on advertising.
The formula is:
ROAS = (Revenue Attributable to Ads ÷ Cost of Ads)
ROAS is the most direct measure of advertising campaign profitability. It helps you understand which channels and campaigns are driving revenue and which are draining your budget. A ROAS of 500% (or 5:1) means you earn $5 for every $1 spent.
9. Marketing efficiency ratio (MER)
Marketing efficiency ratio (MER), or total marketing ROAS, measures the overall efficiency of your entire marketing strategy by comparing total marketing revenue to total marketing spend.
The formula is:
MER = (Total Marketing Revenue ÷ Total Marketing Spend)
While ROAS looks at individual campaigns, MER provides a big-picture view of your marketing health. It helps identify whether your overall strategy is working, even if some individual campaigns are not profitable.
10. Customer acquisition cost (CAC)
Customer acquisition cost (CAC) is the total cost of sales and marketing efforts needed to acquire a new customer.
The formula is:
CAC = (Total Sales & Marketing Spend ÷ Number of New Customers Acquired)
CAC helps determine how much you can afford to spend to acquire customers while remaining profitable.
11. Customer lifetime value (CLV)
Customer lifetime value (CLV) represents the total revenue a business can reasonably expect from a single customer account throughout the business relationship.
The formula is:
CLV = (Average Purchase Value × Purchase Frequency × Average Customer Lifespan)
Why it matters
CLV helps businesses understand the long-term value of their customers, enabling smarter decisions about how much to spend on acquisition and retention. A high CLV indicates strong customer loyalty and sustainable growth potential.
💡 To discover channel strategies that excel at building valuable, long-term customer relationships, learn about the 10 benefits of native advertising that drive engagement and ROI.
12. Customer retention rate (CRR)
Customer retention rate (CRR) is a vital performance indicator that measures the percentage of your existing customers who remain customers over a specific period.
The standard formula for calculating CRR is:
CRR = [(E − N) ÷ S] × 100
Where:
- E = Number of customers at the end of the period
- N = Number of new customers acquired during the period
- S = Number of customers at the start of the period
This calculation isolates the customers you successfully kept from the total you had at the end, providing a pure look at retention. Retained customers typically cost less to service, often buy more over time, and can become vocal advocates for your brand. They contribute directly to a higher customer lifetime value (CLV), which in turn justifies a higher customer acquisition cost (CAC), creating a virtuous cycle of growth.

13. Net promoter score (NPS)
Net promoter score (NPS) is a standardized metric used to gauge customer loyalty, satisfaction, and enthusiasm by measuring their willingness to recommend your company, product, or service to others.
It goes beyond simple satisfaction by capturing the strength of the customer relationship, classifying respondents into three categories: promoters, passives, and detractors.
The measurement is straightforward. Customers are surveyed with the question: "On a scale of 0 to 10, how likely are you to recommend our company to a friend or colleague?" Based on their responses, they are categorized:
- Promoters (score 9–10): Loyal enthusiasts who keep buying and refer others.
- Passives (score 7–8): Satisfied but unenthusiastic customers, vulnerable to competitive offerings.
- Detractors (score 0–6): Unhappy customers who can damage your brand through negative word of mouth.
NPS is calculated as: % Promoters − % Detractors. The score can range from −100 to +100.
A high NPS is strongly correlated with repeat business and organic, word-of-mouth acquisition, which is both highly trusted and low-cost.
14. ROI
Return on investment (ROI) is the fundamental financial metric used to evaluate the efficiency and profitability of an investment. In a marketing context, it measures the net profit generated from your marketing campaigns relative to their total cost.
Unlike ROAS, which focuses solely on direct revenue, ROI provides a holistic view of profitability by accounting for the total cost of investment, including agency fees, creative production, and software expenses.
The standard formula for calculating marketing ROI is:
Marketing ROI = [(Revenue Attributable to Marketing − Cost of Marketing Investment) ÷ Cost of Marketing Investment] × 100
This result is expressed as a percentage. A positive ROI indicates profitability, while a negative ROI signifies a loss.
ROI is the ultimate benchmark for marketing success, directly connecting activities to the company's financial health. By focusing on ROI, you move the conversation from "how much did we spend?" to "what was the financial return on our spend?"
How to improve ROI? While performance channels are easily measured, brand-building efforts like TV and streaming advertising create long-term value. A balanced strategy that builds mental availability in a high-attention environment makes all your performance marketing more effective, thereby improving overall ROI.
💡 To master this balance, AI Digital created this guide to show you exactly how to improve your return on investment by integrating these powerful channels.
15. Attribution accuracy / Data quality score
Attribution accuracy is the foundation that determines the reliability of all other KPIs. A data quality score is a composite measure that evaluates the health and completeness of your marketing data, tracking factors like tracking-code errors, cookie-consent rates, and data-integration gaps.
While there is no single formula, key indicators include:
- Tracking coverage: % of website pages with proper tracking tags installed
- Attribution model discrepancy: Variance in conversion value between first-touch and data-driven models
- Cookie consent rate: % of users accepting analytics cookies
Without accurate attribution and clean data, every other KPI in this guide — from ROAS to CPA — is fundamentally compromised. Poor data quality leads to misguided budget decisions, as you might be scaling channels that appear to be driving conversions but are merely taking credit for them. High attribution accuracy ensures you are investing in the marketing activities that genuinely drive growth, maximizing true marketing ROI.
What counts as a "good" number in 2026?
Benchmarks are directional, not verdicts. A "good" figure depends on your channel, industry, and what you count as a conversion — so treat these as starting points and measure every result against your own baseline. With that caveat, here is where the 2026 numbers sit.
Conversion rate is among the most disputed metrics. The average conversion rate for Google and Microsoft search ads reached 8.18% in 2026, based on more than 13,000 US campaigns running from April 2025 to March 2026. Results vary substantially by industry, illustrating how little a single cross-industry figure reveals on its own.
Landing-page benchmarks vary almost as widely. The median conversion rate across industries is 6.6%, based on 464 million visits to 41,000 landing pages, while the median for SaaS pages is considerably lower at 3.8%. These differences reflect the offer, traffic source, page type, industry and definition of conversion, which makes a page-specific internal baseline more useful than a universal average.
Paid-search CTR also sits in the mid-single digits. WordStream’s 2026 benchmark reports an average CTR of 6.64%, alongside an average CPC of $5.42. The same dataset shows substantial differences between industries, so a single cross-channel CPC benchmark is unlikely to be meaningful.
Paid-social figures depend heavily on campaign objective. WordStream’s 2025 Facebook Ads study, for example, reports different CTR and CPC results for traffic and lead-generation campaigns rather than presenting one universally applicable Facebook benchmark.
Display CTR generally remains below search and paid-social CTR, although the precise result varies by format, placement and targeting.
A ROAS of 4:1 — four dollars in revenue for every dollar spent — is frequently used as a broad rule of thumb, but margins, customer lifetime value, fulfilment costs and operating expenses determine whether that return is genuinely profitable.
For B2B advertising, Dreamdata’s 2026 benchmark report found that LinkedIn generated 121% ROAS during 2025, compared with 67% for Google Search and 51% for Meta. These figures come from Dreamdata’s customer dataset and attributed B2B buying journeys rather than universal platform averages.
Email remains one of the most efficient channels. Mailchimp’s benchmark data puts the average open rate across its users at 35.63% and the average click rate at 2.62%, with substantial differences between sectors. Open rates should also be interpreted cautiously because privacy features such as Apple Mail Privacy Protection can inflate them.
Litmus continues to cite an average email-marketing return of $36 for every $1 spent. Its 2025 State of Email research adds more nuance: 35% of respondents reported returns of $10–$36 per dollar spent, 30% reported $36–$50, and 5% reported more than $50.
Social engagement depends heavily on the denominator used. Results calculated against followers cannot be compared directly with engagement measured against reach, impressions or video views. Platform comparisons should therefore identify both the reporting period and the calculation method rather than presenting engagement as a universally comparable figure.
Net Promoter Score shows a similarly broad spread. SurveyMonkey’s 2025 benchmark data, covering more than 150,000 organisations, places the global average at +32, the median at +44 and the top-quartile threshold at +72. It describes scores above +20 as good and those above +70 as exceptional.
Survicate’s 2025 benchmark report places the overall median NPS at 42, with B2C businesses recording 49 against 38 for B2B. Software had the lowest overall industry average at 30, including 29 for B2B software and 47 for B2C software.
The consistent lesson is to present ranges, identify the source, year and methodology, and compare performance with your own history. An improvement against a relevant internal baseline usually reveals more than a broad industry average.
{{dmkpi-3}}
How to choose the right KPIs for your campaign
Choosing the right digital marketing KPIs is not a one-size-fits-all process; it's a strategic exercise in alignment. The most effective key performance indicators are those that directly reflect your campaign's primary objective. By mapping your goals to specific marketing performance indicators, you create a focused marketing dashboard that provides actionable insights and a clear measure of success.
{{dmkpi-4}}
Putting it into practice:
- For an awareness campaign launching a new product, focus on CTR and impressions to gauge initial interest and reach, not CPA. A high number of impressions at a low cost indicates you are efficiently building visibility.
- For a conversion campaign promoting a limited-time sale, CVR and ROAS are your north stars. They tell you whether your offer is compelling and whether the campaign is profitable, making metrics like social media likes secondary.
- For a retention campaign aimed at existing customers, tracking NPS and CLV helps you understand customer satisfaction and long-term profitability, guiding investments in loyalty programs and customer service.
Measuring and reporting KPIs effectively
Collecting data is only half the battle; the true power of digital marketing KPIs is unlocked through effective measurement, visualization, and interpretation. Manual reporting is no longer sufficient. To keep pace with the customer journey, you need AI automation and sophisticated data-visualization tools that provide a unified, actionable view of performance.
But no platform grades itself honestly, and none of them sees the whole picture. Pull your numbers from each channel separately and you end up with a dozen dashboards that never quite agree — the same conversion counted three ways, the same week telling three different stories.
That's the gap Elevate closes. AI Digital's intelligence platform sits across 12+ DSPs and every channel you run — streaming TV, digital advertising, owned properties — and pulls them into one measured view, from top-funnel brand lift to bottom-funnel ROI. It doesn't bid or buy on your behalf; it reads what everything is doing and shows you where the budget is actually working.
What that looks like in practice:
- Cross-channel attribution and path-to-conversion, so every touch gets its fair share of the credit
- AI-assisted media planning and media mix modeling that forecast where the next dollar goes furthest
- Reporting built to surface the revenue-linked metrics and push the vanity ones out of the way
- One standardized read across platforms, instead of manual reconciliation between them
In short, Elevate replaces fragmented, after-the-fact reporting with a single, current view you can plan against.
Common mistakes when tracking KPIs
Even with the best intentions, marketers often fall into common traps that undermine their ability to measure digital marketing success. Avoiding these errors is crucial for maintaining data integrity and making sound strategic decisions.
{{dmkpi-5}}
💡 The future of KPI tracking is intelligent and integrated. To understand how artificial intelligence is solving these very challenges, read AI in digital marketing: how artificial intelligence is transforming strategies in 2026.
Conclusion: turning metrics into marketing insight
Most marketing teams track too much and trust too little of it. The fix is narrowing to the few that move revenue — ROAS, CPA, CLV, NPS — and letting those, not instinct, call where the money goes next.
Getting there takes a bit of discipline.
- Pick the few KPIs tied to growth and give the rest less of your attention.
- Read your dashboard as something live, not as a record of what already happened.
- And treat every result as a question rather than a verdict — a reason to test the next thing, not a grade to file away.
- Do that consistently and your measurement stops describing the past and starts shaping what you do about it.
The hard part is rarely the individual metric. It's seeing all of them at once, cleanly, across every channel you run — which is the problem AI Digital built Elevate to solve. It reads your performance across platforms, tells you where the money is genuinely working, and puts that in front of the person making the call, so the decision is an informed one rather than a guess.
If you'd rather not untangle that alone, talk to us. We'll help you decide which KPIs matter for your business and build the measurement to back them — and you can take it from there.