eCPM, rCPM, and Fill Rate: What They Mean and How to Calculate Them

If eCPM is your primary scorecard, it’s easy to miss the real reason revenue moves—or doesn’t. eCPM meaning is simple enough: what you earned per 1,000 impressions served. But monetization doesn’t start at the impression. It starts at the request, where demand may (or may not) show up, auctions may time out, and pricing rules decide whether a bid ever gets a chance to win. That’s why rcpm meaning matters: it measures revenue against the full set of opportunities, not just the impressions that made it through.
This article breaks down eCPM vs RPM and ad fill rate in practical terms. You’ll get the formulas, a few clean examples, and a decision framework you can actually use—so you can tell whether the next fix lives in yield (pricing and formats), coverage (demand and eligibility), or delivery (latency and timeouts).
💡 If you want a quick refresher on KPI design and why “the right metric” depends on your decision, see 15 essential digital marketing KPIs to track.
Why eCPM, rCPM, and fill rate matter in monetization
These metrics matter because they’re often pointing at different bottlenecks—and the bottleneck is what decides your next move.
{{26-eCPM-rCPM-and-Fill-Rate-1="/tables"}}
Here’s the simplest way to think about it:
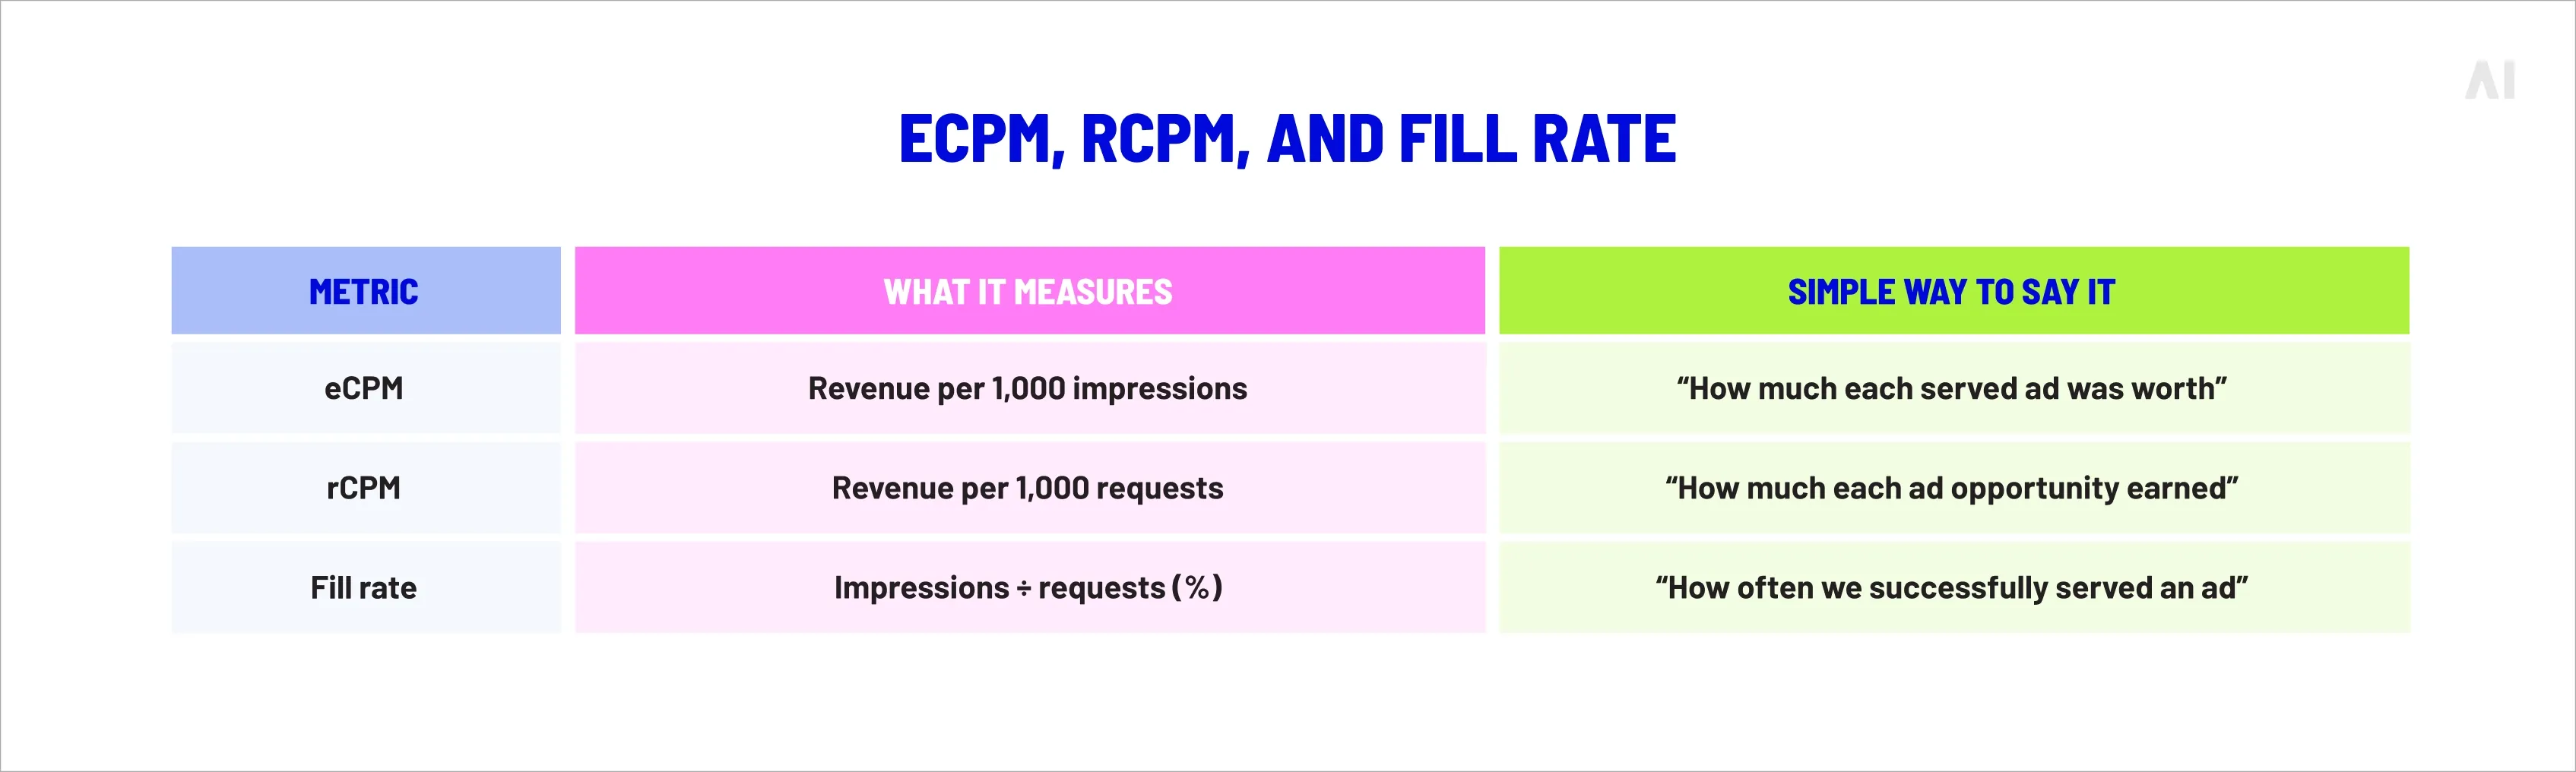
- eCPM is a yield metric. It tells you the average revenue per 1,000 impressions that actually served.
- Fill rate is a coverage metric. It tells you what share of requests turned into impressions.
- rCPM is an efficiency metric. It tells you how much revenue you earned per 1,000 requests—meaning it naturally “penalizes” unfilled requests.
That distinction matters in a market where publisher revenue is large, competitive, and sensitive to small operational changes. That scale is also why teams care about basis-point improvements. It’s also why “optimizing the wrong KPI” can create expensive blind spots.
Advertisers vs publishers interpret CPM metrics differently
Advertisers typically think in CPM terms as a cost: what they paid per 1,000 impressions. Publishers use CPM-like metrics as yield: what they earned per 1,000 impressions. Same unit, different question.
That’s why conversations can get crossed:
- A buyer can be happy with a CPM if it produced outcomes at a reasonable CPA.
- A publisher can be unhappy with the same CPM if it came with low fill, low viewability, or high latency that suppressed overall volume.
💡 If you want a deeper breakdown of CPM in TV and streaming contexts—where impression delivery and measurement can add extra layers—see How CPM influences TV ad performance.
⚡ A high eCPM is not a win if it arrives attached to fewer impressions.
What is eCPM? (Effective Cost Per Mille)
eCPM is the average revenue you earn per 1,000 impressions served. It’s the default yield metric for publishers because it makes performance comparable across ad units, placements, devices, formats, and demand sources.
In practice, eCPM helps you answer questions like:
- Which placement is earning more per impression?
- Did a new format (sticky, video, native) lift yield?
- Is one demand partner pricing higher than another on served impressions?
Just remember what eCPM doesn’t tell you: it doesn’t care how many requests went unfilled. If you want to understand “total opportunity,” you need the other two metrics.
eCPM formula
Here’s the eCPM formula:
eCPM = (Total ad revenue ÷ Total impressions) × 1,000
Where:
- Total ad revenue is the revenue earned from the impressions served (in your reporting currency).
- Total impressions is the number of ads that actually served (not requests).
Worked example: Imagine a placement served 1,000,000 impressions and earned $3,200.
- eCPM = ($3,200 ÷ 1,000,000) × 1,000
- eCPM = $3.20
That’s a clear number. But it’s only half the story, because it tells you nothing about whether you had 1,050,000 requests or 1,800,000 requests to get those impressions.
How to improve eCPM without damaging UX
The goal is to raise yield per served impression while protecting user experience signals that buyers care about (viewability, engagement, completion rate, brand safety) and that users feel (speed, clutter, stability).
Here are practical levers that tend to move eCPM without turning pages into ad farms.
- Tighten placement quality before you add more inventory: Start with what’s already on the page.
- Audit viewability by placement and device.
- Identify units that load but sit below the fold too often.
- Remove or redesign placements that consistently underperform.
A smaller set of high-performing units often beats “more slots” because it concentrates demand on inventory buyers actually want.
- Improve viewability with layout and rendering discipline: Most viewability problems are self-inflicted: poor placement, late loads, and layout shift.
Do the basics well:
- Avoid pushing key units into unstable containers.
- Reduce cumulative layout shift (CLS) triggered by ad container resizing.
- Use reserved space for ad slots so content doesn’t jump.
This is where UX and yield align: the same fixes that make pages calmer often improve what buyers are willing to pay.
- Use lazy loading strategically (not blindly): Lazy loading can increase viewability by loading ads closer to when they can be seen, but it can also reduce demand competition if bidders time out.
Good lazy loading is intentional:
- Trigger when the user is approaching the slot, not when they are already past it.
- Test thresholds separately for mobile and desktop.
- Watch timeouts and bid density after changes.
- Increase demand competition in a controlled way: More demand partners can increase bid pressure, but it can also increase latency and create operational noise.
A practical approach:
- Add partners gradually.
- Measure the incremental lift (not just “more bids”).
- Remove underperformers that add time without adding money.
- Revisit floors, but treat them like a tuning knob: Floors can lift eCPM by refusing low bids. They can also crush fill if they’re set above what your traffic can clear.
What works better than “set it and forget it”:
- Use floor tests by geo and device.
- Consider different floors for different formats and placements.
- Track what happens to both eCPM and fill rate.
- Adjust format mix where it makes sense: Format changes can lift eCPM, especially when they match user intent.
Examples that often work when done carefully:
- Native units in feed-based layouts
- Rewarded or opt-in video where the experience supports it
- Larger formats on higher-attention screens (where policy and UX allow)
- Reduce latency to protect the value of the impression: An impression that arrives late is often a cheaper impression. It can miss the moment of attention, reduce viewability, or fail entirely.
This is one of the easiest “hidden” eCPM killers because it doesn’t always show up as a single obvious error. It shows up as a slow leak across many auctions.
⚡ Yield improvements that break experience quality are usually temporary. The market prices that in.
What is rCPM (RPM)?
rCPM is revenue per 1,000 ad requests, not per 1,000 impressions. It answers a more operational question than eCPM: How efficiently did your inventory convert opportunities into revenue?
Why that matters:
- If a request goes unfilled, it produces $0.
- eCPM ignores that request.
- rCPM includes it in the denominator.
So rCPM will often look “worse” than eCPM, but it can be more honest about total monetization performance.
{{26-eCPM-rCPM-and-Fill-Rate-2="/tables"}}
This is why rCPM is frequently used for partner evaluation, auction setup comparisons, and inventory diagnostics. It’s also why the ecpm vs rpm comparison can be revealing: when the gap is big, fill or delivery is usually the story.
rCPM formula
Here’s the rCPM formula:
rCPM = (Total ad revenue ÷ Total ad requests) × 1,000
Where:
- Total ad revenue is revenue earned from impressions served.
- Total ad requests is the number of times your page/app requested an ad (including requests that resulted in no ad).
Worked example
You earn the same $3,200, but you had 1,600,000 ad requests in that period.
- rCPM = ($3,200 ÷ 1,600,000) × 1,000
- rCPM = $2.00
That’s a meaningful difference from the $3.20 eCPM example earlier. Nothing changed about the money you earned. You simply measured it against the full set of opportunities.
Why rCPM is often better for partner comparison
If you compare partners using eCPM alone, you can end up rewarding a partner that prices high but fills poorly.
A simplified example shows the trap:
- Partner A clears high bids, but only wins a small share of auctions.
- Partner B clears at lower prices, but fills more of your requests.
eCPM might make Partner A look better. rCPM might show Partner B generates more total revenue per unit of inventory opportunity.
Here’s the practical reason: rCPM forces you to care about the “zeros.” Those zeros are usually where revenue is quietly lost.
When you’re assessing SSPs, networks, or auction setups, rCPM gives you a cleaner “who makes me more money per request?” view, especially if you segment by geo and device.
💡 Related read: What is a supply-side platform (SSP)?
What is fill rate?
Fill rate is the percentage of ad requests that result in an impression served. It’s your clearest indicator of demand coverage and delivery health.
High fill rate can be a good sign. It can also be a warning, depending on how you achieved it.
- If fill rate is high because demand is strong and latency is low, great.
- If fill rate is high because floors are low and low-quality demand is flooding in, you may be trading long-term yield for short-term volume.
Fill rate is also easy to misinterpret because different platforms report “fill” slightly differently (responses vs impressions, bids vs served). For the purposes of this article—and for most revenue math—the useful version is impressions ÷ requests.
💡 If you’re working in CTV or streaming environments where measurement and delivery can vary by platform, CTV measurement is a helpful companion read.
Fill rate formula
Here’s the fill rate formula:
Fill rate = (Impressions served ÷ Ad request) x 100%
Example:
You had 1,600,000 ad requests and served 1,000,000 impressions.
- Fill rate = (1,000,000 ÷ 1,600,000) × 100%
- Fill rate = 62.5%
That 37.5% gap is not automatically “bad.” It’s a signal. Your job is to figure out which part of the system created it.
Why fill rate drops (most common causes)
A fill rate drop usually comes from one of three buckets: demand, price, or delivery. The fastest way to diagnose is to rule out obvious delivery issues first, then look at price, then look at demand quality and match.
Here are the most common causes, with the practical “what to check” next to each one.
- Low demand in your segment. Check: geo/device splits, dayparting effects, seasonality, category blocklists.
- Floors set too high for the traffic mix. Check: win rates by floor bucket, bid landscape, partner-level clearing prices.
- Geo mismatch between inventory and buyer demand. Check: demand by country/state/metro; isolate US vs non-US traffic if you have both.
- Inventory quality or policy constraints. Check: content adjacency, brand safety settings, IVT flags, creative policy rejections.
- Latency and timeouts. Check: timeout settings, bidder response times, client-side vs server-side auction path.
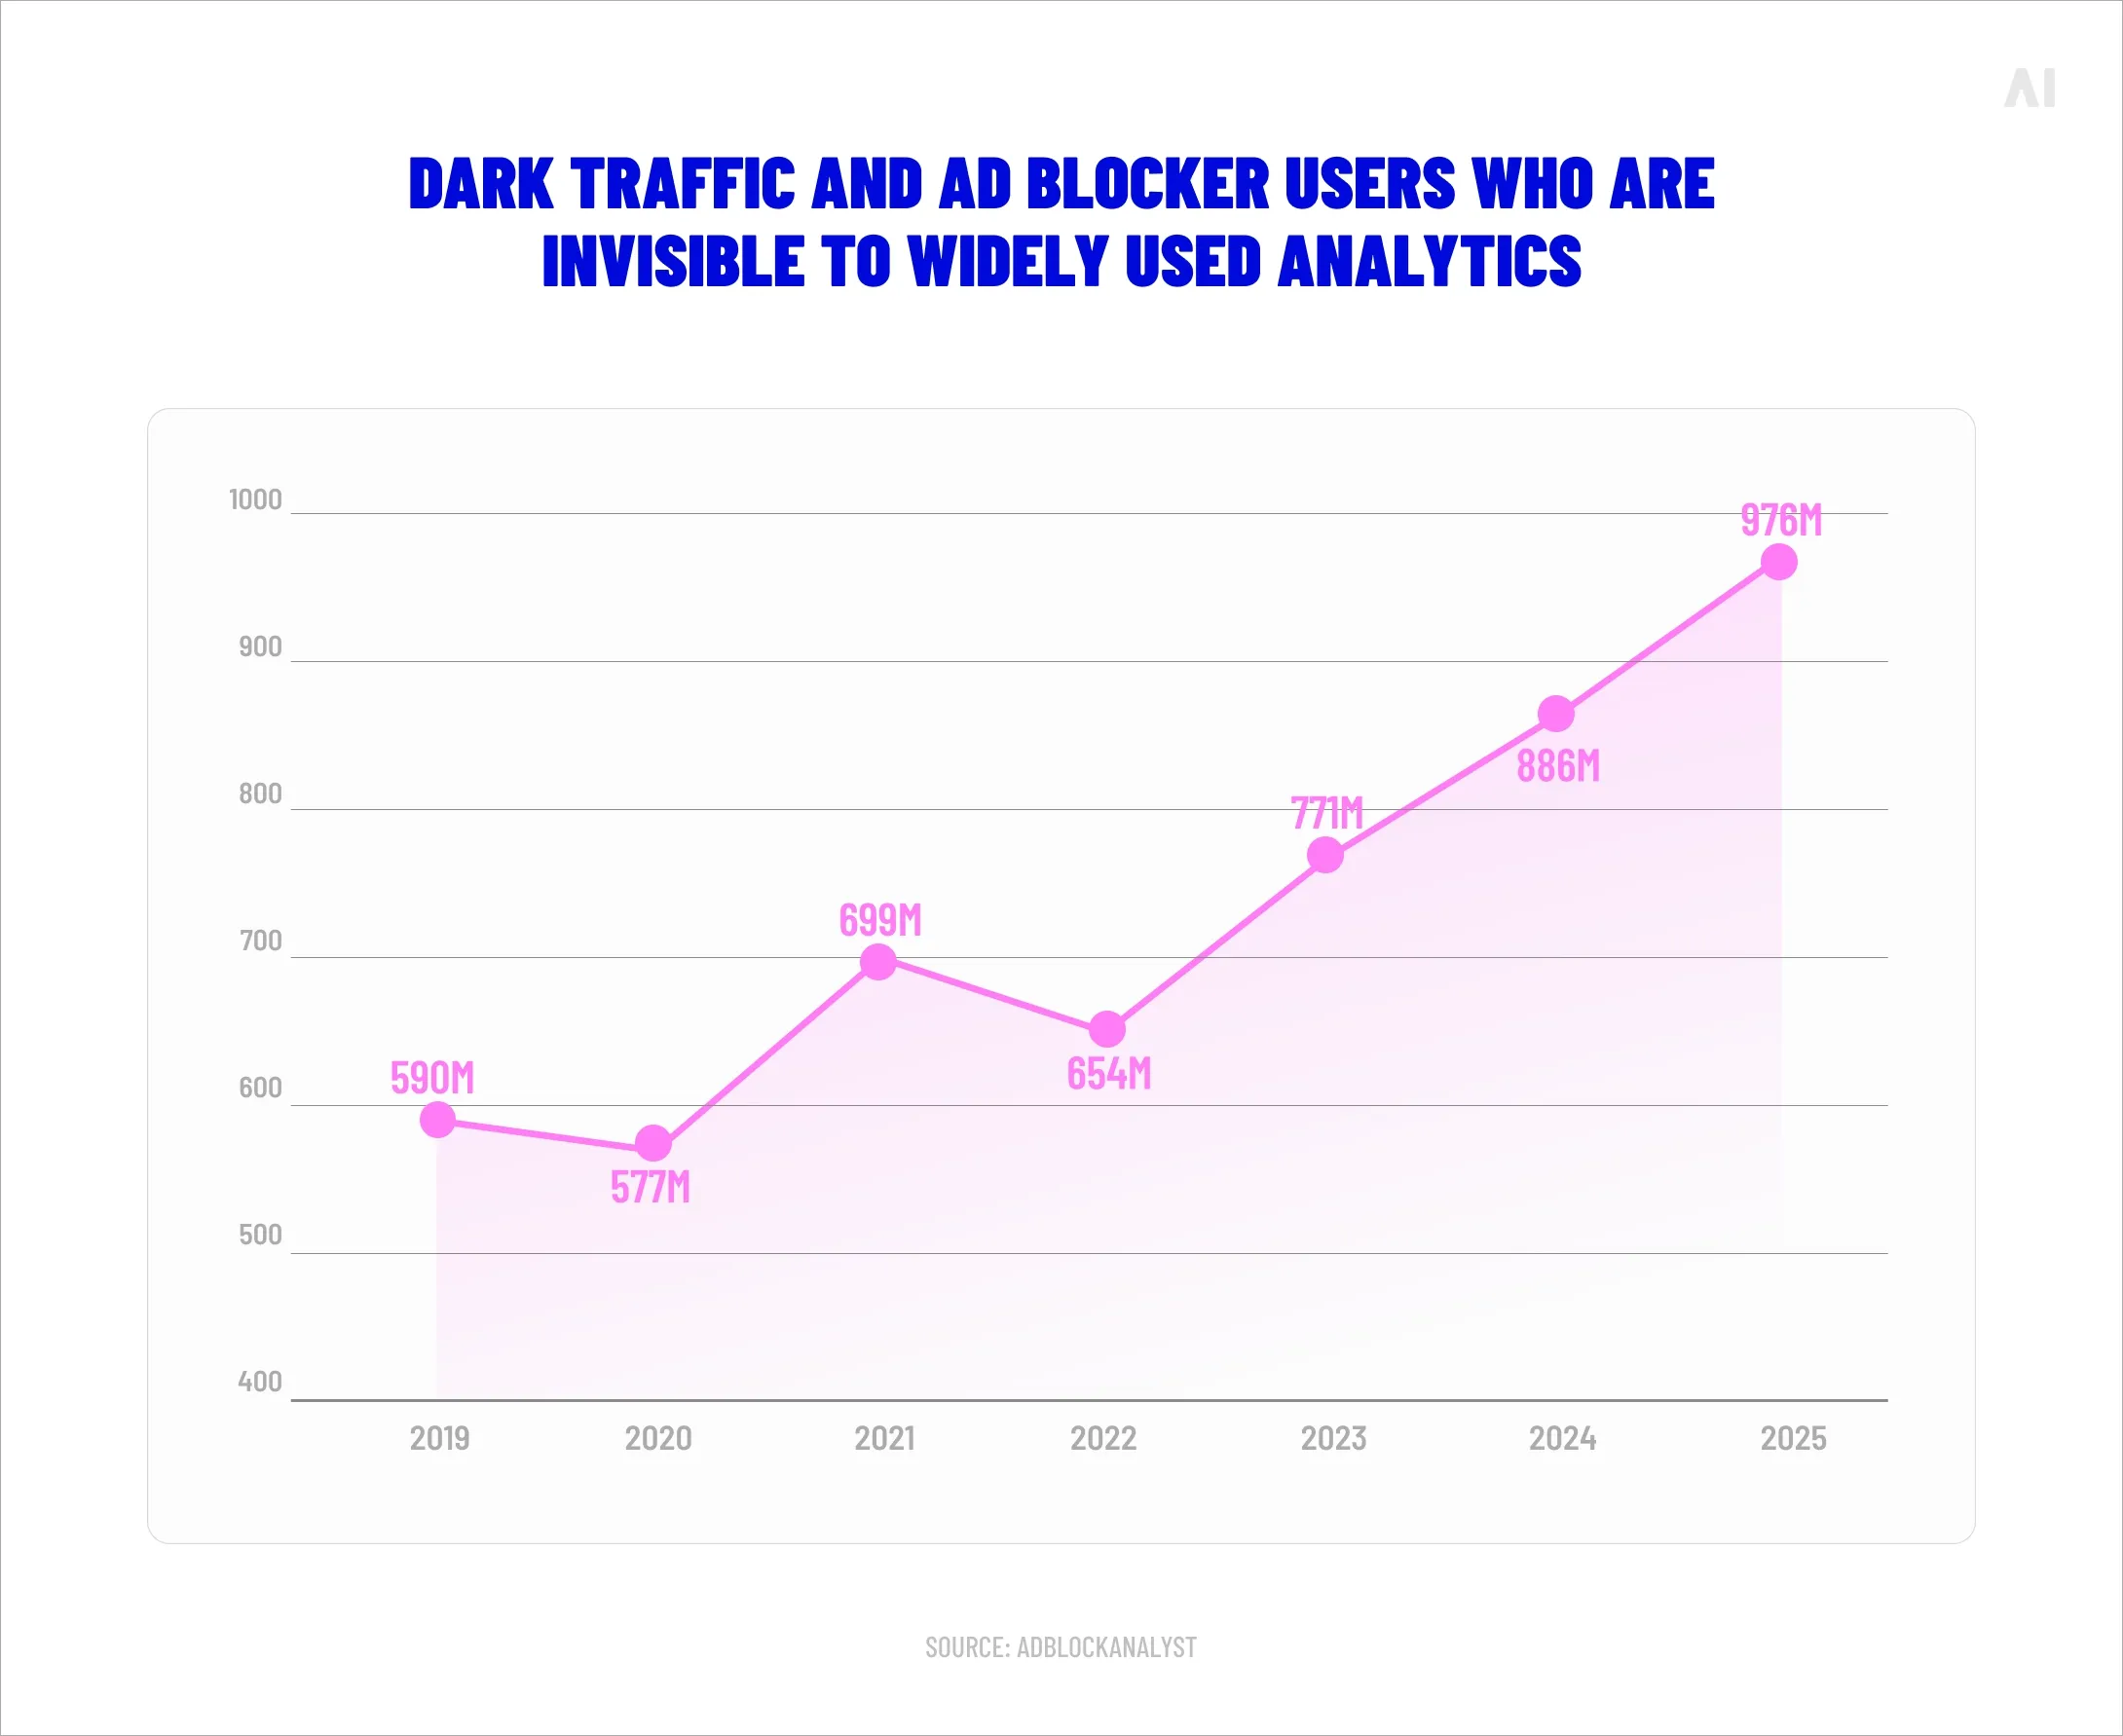
- Ad blockers and tracking prevention. Check: browser splits, consent rates, discrepancy logs, blocked calls.
- Low viewability or poor on-page placement.Check: viewability distribution, scroll depth, placement heatmaps.
- Page speed and rendering instability. Check: Core Web Vitals, CLS spikes, long tasks on ad-heavy pages.
The key point is that “fill is low” is not an answer. It’s the start of a very solvable investigation.
How to improve fill rate without killing yield
The best fill improvements don’t come from lowering floors until everything clears. They come from removing friction so the right demand can compete, and from aligning price strategy with your traffic reality.
A good order of operations looks like this:
- Fix delivery first. Reduce timeouts caused by slow auctions, broken tags, misconfigured wrappers, or overloaded pages. You can’t price your way out of a technical bottleneck.
- Tune timeout settings to your environment. Too short, and you miss competitive bids. Too long, and you load late and damage user experience. The “right” number depends on device mix, region, and the partners you run.
- Segment floors instead of applying one global rule. US desktop, US mobile, and non-US traffic often clear at different levels. A single floor can be a blunt instrument.
- Add demand partners only where they add incremental value. Extra bidders can raise fill, but they can also add latency and make auctions noisier. Measure the incremental lift partner by partner.
- Balance formats and refresh policies carefully. Aggressive refresh can lift impression volume, but it can also reduce attention and harm viewability. When refresh is used, tie it to meaningful engagement signals (time-in-view, scroll depth, playback state).
- Use programmatic optimization as a system, not a hack. The best results come from coordinated changes across ad server, wrapper, demand, and page performance—not a single lever pulled hard.
⚡ Fill rate improvements should feel like removing friction, not lowering standards.
eCPM vs rCPM vs Fill Rate: how they work together
These metrics are intertwined because they describe the same flow from two angles: how many chances you had (requests), how many you converted (impressions), and how much you earned (revenue). If you line them up in that order, most “mystery” monetization swings stop being mysterious.
Think of it as a simple pipeline:
Requests → Impressions → Revenue
- Fill rate tells you how efficiently requests become impressions (coverage and eligibility).
- eCPM tells you how efficiently impressions become revenue (yield on what served).
- rCPM tells you how efficiently requests become revenue (the full, end-to-end result).
That’s why rCPM is the bridge. It’s the only metric that reflects both how much you sold and how well you sold it, without forcing you to interpret them separately.
The mental model (with a “what changed?” lens)
When numbers move, ask one question first: Did the change start before the impression, or after it?
- If rCPM drops and fill rate drops (but eCPM stays flat), the issue is usually coverage/delivery: demand mismatch, floors too high, timeouts, eligibility constraints.
- If rCPM drops and eCPM drops (but fill is steady), the issue is usually yield: weaker demand, worse auction pressure, format/placement changes, lower viewability.
- If eCPM rises but rCPM doesn’t, you likely improved yield on a smaller slice while leaving more requests unfilled. That can be acceptable in premium segments, but it’s often a sign to inspect floors, latency, or demand density.
This is the practical value of tracking the trio: it tells you where in the pipeline the problem (or opportunity) lives.
The key relationship (simple explanation)
When fill rate is defined as impressions ÷ requests, a useful relationship appears:
rCPM ≈ eCPM × (Fill rate as a decimal)
It’s not a heuristic. It falls straight out of the definitions:
- eCPM = (Revenue ÷ Impressions) × 1,000
- Fill rate = Impressions ÷ Requests
- Multiply them: (Revenue ÷ Requests) × 1,000, which is rCPM
So you can treat rCPM as “eCPM, adjusted for how often you actually managed to serve an ad.”
A small table makes it concrete:
{{26-eCPM-rCPM-and-Fill-Rate-3="/tables"}}
Scenario A wins on eCPM because the impressions that served were pricey. Scenario B wins on rCPM because it turned more requests into money overall.
If your goal is total revenue, Scenario B often wins because it monetizes more of what you had available. Scenario A can still be the right strategy in premium contexts, but only if you’re intentionally trading volume for price and you understand where the “zeros” are coming from.
Why high eCPM can still mean low revenue
High eCPM can coexist with low total revenue when one (or more) of these is true:
- Fill rate is low: You’re pricing high, but you’re leaving a meaningful share of requests unmonetized. In practice, this often happens when floors are too aggressive for certain geos/devices, or auctions are timing out.
- Impression volume is constrained: Traffic is down, sessions are shorter, or delivery is slower. Even “great” eCPM doesn’t help if the impression count collapses.
- Your high eCPM is coming from a narrow slice: For example, US desktop clears strongly, while mobile or non-US traffic underfills. The blended eCPM can look healthy while overall revenue is dragged down by segments that aren’t converting requests into impressions.
A reliable early warning is to chart all three metrics together for the same segment. When eCPM rises but rCPM stays flat (or drops), you’re usually looking at a coverage or delivery issue—not a genuine revenue lift.
When to focus on each metric
You don’t need to argue about which metric is “best.” You need to match the metric to the decision.
Focus on eCPM when:
- You’re comparing placement yield (same inventory type, which earns more per impression?)
- You’re testing formats, layout changes, or viewability improvements
- You’re tuning floors and want to see the yield impact on served impressions
Focus on fill rate when:
- You suspect demand gaps, eligibility constraints, or technical bottlenecks
- You see the gap between requests and impressions widening
- You’ve changed something that can affect delivery (timeouts, wrappers, page speed, consent logic)
Focus on rCPM when:
- You’re evaluating partners or auction setups and want an apples-to-apples efficiency metric
- You’re trying to understand why total revenue is flat despite decent eCPM
- You want a single headline number that reflects both yield and coverage
If you remember one thing: use eCPM to improve the value of what you sold, and use rCPM to improve how much value you extracted from what you had available.
Key factors that impact eCPM, rCPM, and Fill Rate
All three metrics are shaped by the same forces, but they react differently. A change that lifts eCPM can hurt fill rate. A change that lifts fill rate can hurt eCPM. The job is to manage the trade-offs consciously.
{{26-eCPM-rCPM-and-Fill-Rate-4="/tables"}}
The factors below are the ones that most consistently move outcomes across publisher stacks.
Demand quality and auction competition
Better competition usually lifts eCPM and can lift rCPM—if delivery keeps up. The clearest driver is more qualified bidders competing on the same impression.

In the 2025 release of the IAB/PwC full-year 2024 report, programmatic advertising revenue was reported at $134.8B in 2024. That headline isn’t just trivia. It’s a reminder that for many publishers, the auction environment is the monetization environment. The quality of demand, the ability of buyers to bid, and the efficiency of the auction path matter.
Practical levers that affect competition:
- Header bidding configuration (who can bid, how, and when)
- Bidder overlap and redundancy (more bidders isn’t always more competition)
- Deal strategy (open auction vs PMPs vs programmatic guaranteed)
- Ad server prioritization rules (how line items are structured and compete)
A useful habit is to track not just CPMs, but also:
- bid rate (how often partners respond)
- win rate (how often responses clear)
- timeout rate (how often responses arrive too late to matter)
Those “plumbing” metrics often explain your eCPM and fill rate trends faster than staring at the revenue number.
Ad formats and placement strategy
Format and placement choices shape both buyer demand and user attention. They’re one of the few levers you control directly.
A simple way to frame it:
- Formats that earn higher eCPM often do so because they capture more attention (video, high-impact units, high-viewability placements).
- Formats that preserve UX often do so because they respect flow (native, well-placed display) and don’t interrupt.
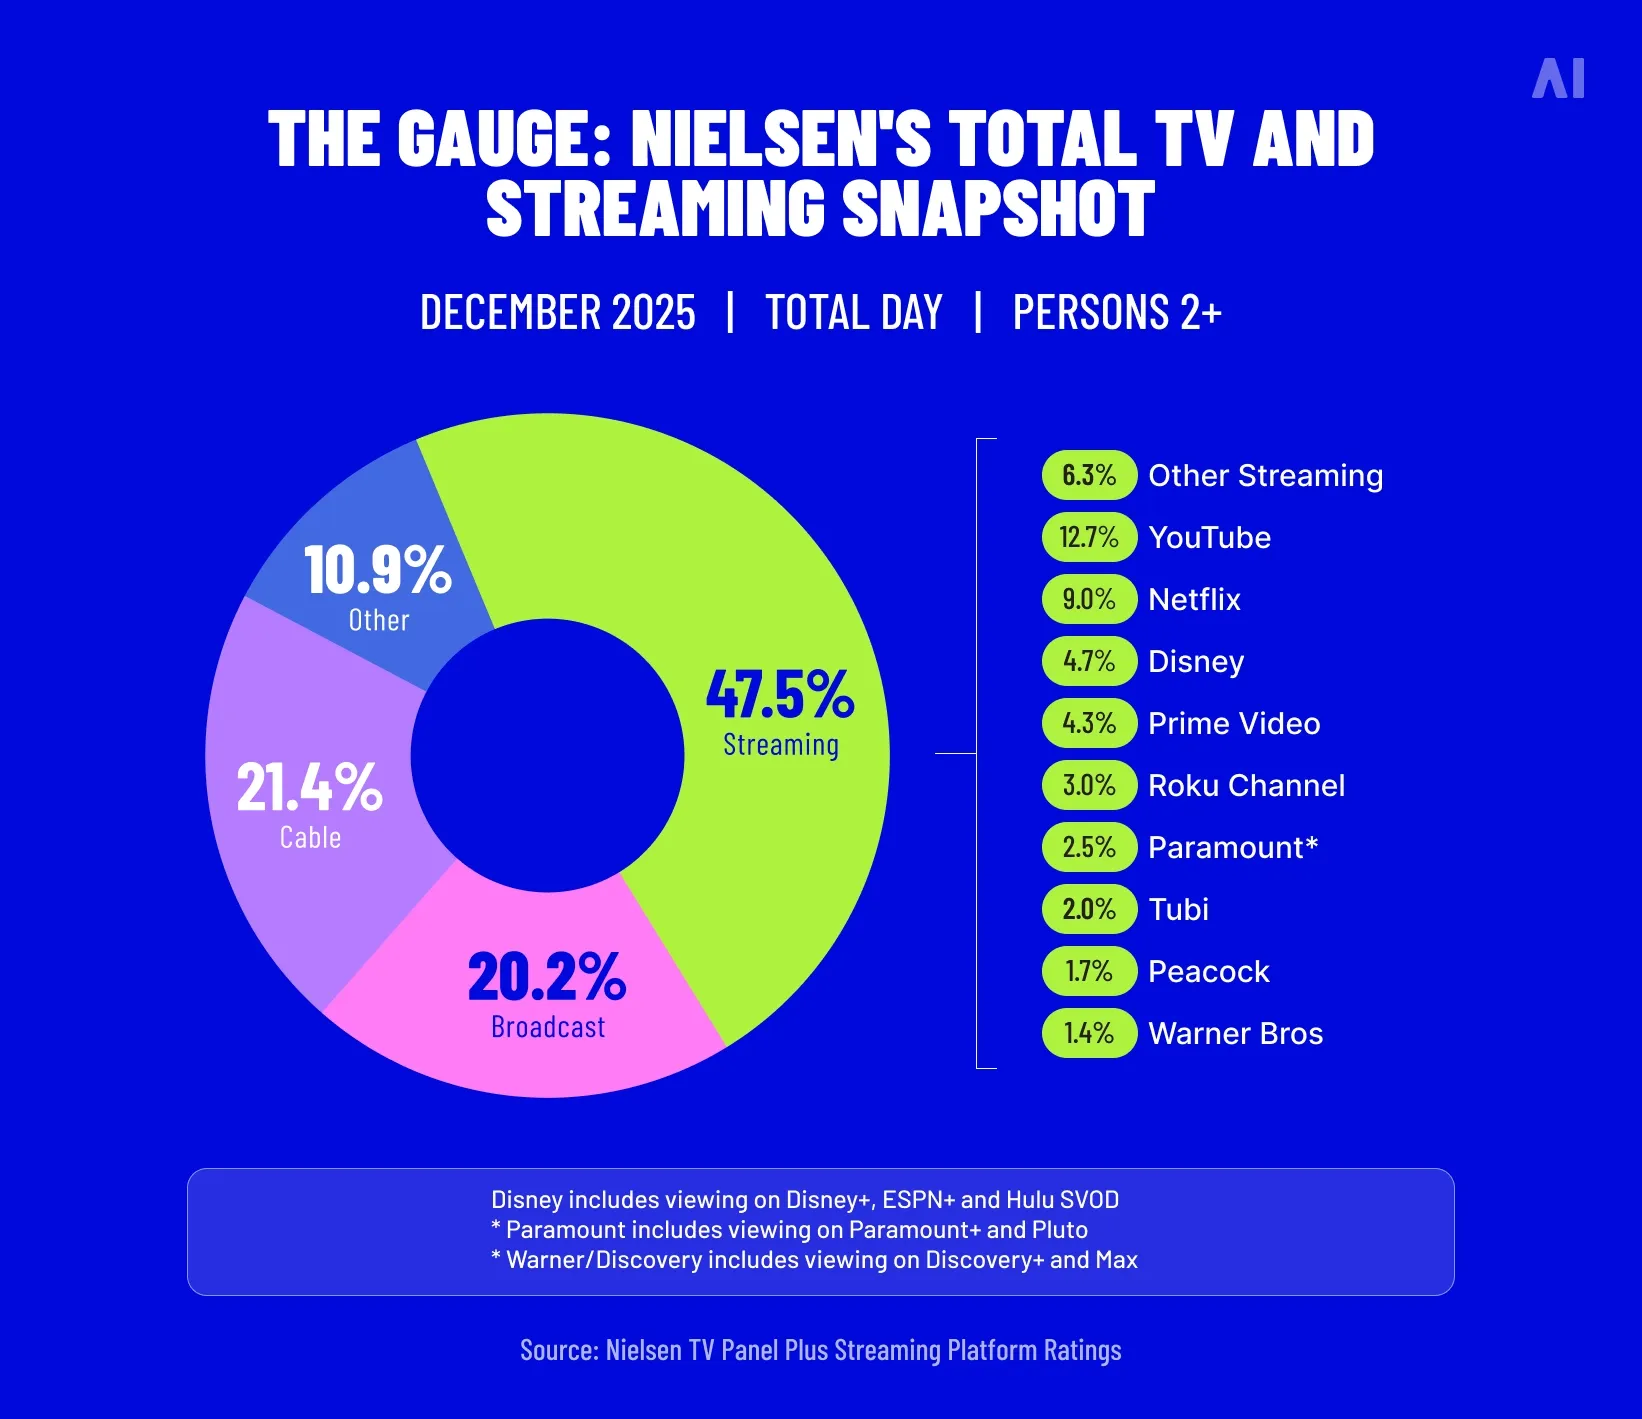
In streaming environments, demand conditions can be strong, but measurement and supply pathways get complex. For context on the broader shift, Nielsen reported that streaming represented 47.5% of overall TV time in the US as of December 2025. That change influences how buyers allocate budgets, which formats they prioritize, and how they price inventory across screens.
💡 If your inventory includes smart TV or streaming placements, you’ll want to think about formats, creative constraints, and measurement as a single system. Smart TV advertising guide is a useful primer for that.
Practical placement considerations that consistently move results:
- Above-the-fold isn’t always better. If a top-slot unit triggers layout instability, loads too early, or fires before consent logic is settled, you can lose both UX and demand eligibility. The result is often lower fill rate, not higher yield.
- High-viewability placements are valuable, but they’re not free. Buyers tend to bid more aggressively on placements that consistently meet viewability thresholds, yet those same placements are more sensitive to clutter, slow rendering, and bad creative behavior. Treat them as premium inventory and protect the experience.
- Frequency and refresh policies can lift impression volume, then quietly erode attention. Refresh can increase delivered impressions and sometimes stabilise fill, but aggressive policies can reduce viewability per impression, trigger buyer fatigue, and drag down eCPM over time. Tie refresh to real engagement signals (time-in-view, scroll depth, playback state), and test incrementally.
Geo, device, and traffic source mix
The same placement can have different economics depending on who is viewing it and how they arrived. That’s why averages can mislead.
What typically changes across segments:
- Buyer demand density (US vs non-US, metro vs rural)
- Device behaviour (mobile scroll patterns vs desktop dwell time)
- Browser constraints (tracking prevention, consent mechanics)
- Traffic quality (direct vs social vs search, new vs returning users)
A practical approach:
- Create “core segments” you always report: US desktop, US mobile, US CTV (if relevant), and non-US.
- Track eCPM, rCPM, and fill rate separately for each.
That single step removes a lot of confusion, because you stop asking one metric to explain multiple realities at once.
💡 Related read: Geotargeting vs. geofencing: How to choose the right location strategy for your ads.
Latency, timeouts, and ad blockers
Latency is one of the most common hidden drivers of fill rate loss. If the auction takes too long, you don’t just lose impressions. You lose the competitive bids that might have improved eCPM.
This is where ad stacks become systems thinking problems. Changes that look “good” in isolation can backfire once they move through the whole delivery chain:
- More partners can increase bid competition. That can lift eCPM if the added bidders are genuinely incremental and can respond in time.
- More partners can also increase response times and timeouts. Extra demand adds extra calls, and not every environment can handle that load cleanly.
- Timeouts reduce fill rate and suppress rCPM. Late bids don’t win auctions; they just slow the page and leave requests unmonetized.
- Longer timeouts can increase served impressions, but at a cost. If ads arrive late, you can harm user experience, reduce viewability, and weaken long-term pricing because buyers see poorer performance.

The right posture is testing:
- Measure bidder response times by device and geo.
- Set timeouts based on observed performance, not guesswork.
- Trim slow partners that contribute little incremental revenue.
- Optimize page performance so the browser has time to execute the auction cleanly.
Ad blockers and tracking prevention add a second layer. Even when ads can serve, tracking and measurement may be constrained, which affects what buyers are willing to pay over time. The exact impact varies heavily by browser, consent rates, and audience profile, so treat it as a segment-specific issue rather than a global assumption.
Which metric should you use for monetization decisions?
You should choose the metric that matches the decision you’re making, then use the other two to check for unintended consequences.
A clean way to operationalize this is: primary metric + two guardrails.
{{26-eCPM-rCPM-and-Fill-Rate-5="/tables"}}
Use eCPM for yield optimization
Use eCPM when the question is, “Which impressions are worth more?”
This is the right tool for:
- comparing placements and formats
- testing floor changes (with caution)
- evaluating creative and viewability improvements
- monitoring yield changes after demand shifts
Guardrails: Always check fill rate and rCPM after eCPM improvements. A lift that comes with a fill collapse is not a lift. It’s a reshuffle.
Use rCPM for real revenue efficiency
Use rCPM when the question is, “Which setup makes more money per opportunity?”
This is the strongest metric for:
- comparing partners (SSPs, networks, auction setups)
- prioritizing which segments to fix first
- diagnosing “good eCPM, bad revenue” situations
- tracking improvements that should show up in total earnings
Guardrails: If rCPM rises because fill rate rises while eCPM collapses, you may be monetizing more inventory at worse prices. That can be fine temporarily, but it’s rarely the long-term optimum.
Use fill rate to identify lost revenue potential
Use fill rate when the question is, “How much inventory is slipping through unmonetized?”
Fill rate is most valuable when:
- it changes quickly after a technical or policy update
- it varies sharply by segment (geo/device/browser)
- you suspect delivery issues (timeouts, rejections, broken tags)
Guardrails: Fill rate without pricing context can mislead. A 95% fill rate is not automatically good if it’s achieved by clearing low-quality demand that drags down overall yield.
The best approach: track all three together
If you can build one reporting habit, build this one:
- eCPM tells you if the impressions you served were priced well.
- Fill rate tells you how many chances you converted into impressions.
- rCPM tells you how efficiently you turned total opportunity into revenue.
A practical weekly review can be short and effective:
- Start with rCPM trends (is revenue efficiency up or down?).
- Check eCPM (did pricing move?).
- Check fill rate (did coverage move?).
- Drill into segments only where something changed materially.
This avoids “dashboard wandering” and keeps your actions connected to outcomes.
Conclusion: Unlock revenue potential with smart eCPM, rCPM, and Fill Rate
eCPM, rCPM, and fill rate aren’t competing metrics. They’re three parts of the same equation, each exposing a different failure mode.
- eCPM helps you improve yield on served impressions.
- Fill rate helps you find demand gaps and delivery friction.
- rCPM helps you judge real monetization efficiency—especially when comparing partners or diagnosing revenue plateaus.
When you use them together, you stop optimizing in circles. You can see whether you need better competition, better delivery, better pricing strategy, or simply cleaner segmentation.
If you want help instrumenting these metrics, diagnosing gaps, or building a practical optimization roadmap, the next step is a direct conversation: Get in touch!
.webp)