How to Gain Full Visibility Across Your Marketing Ecosystem

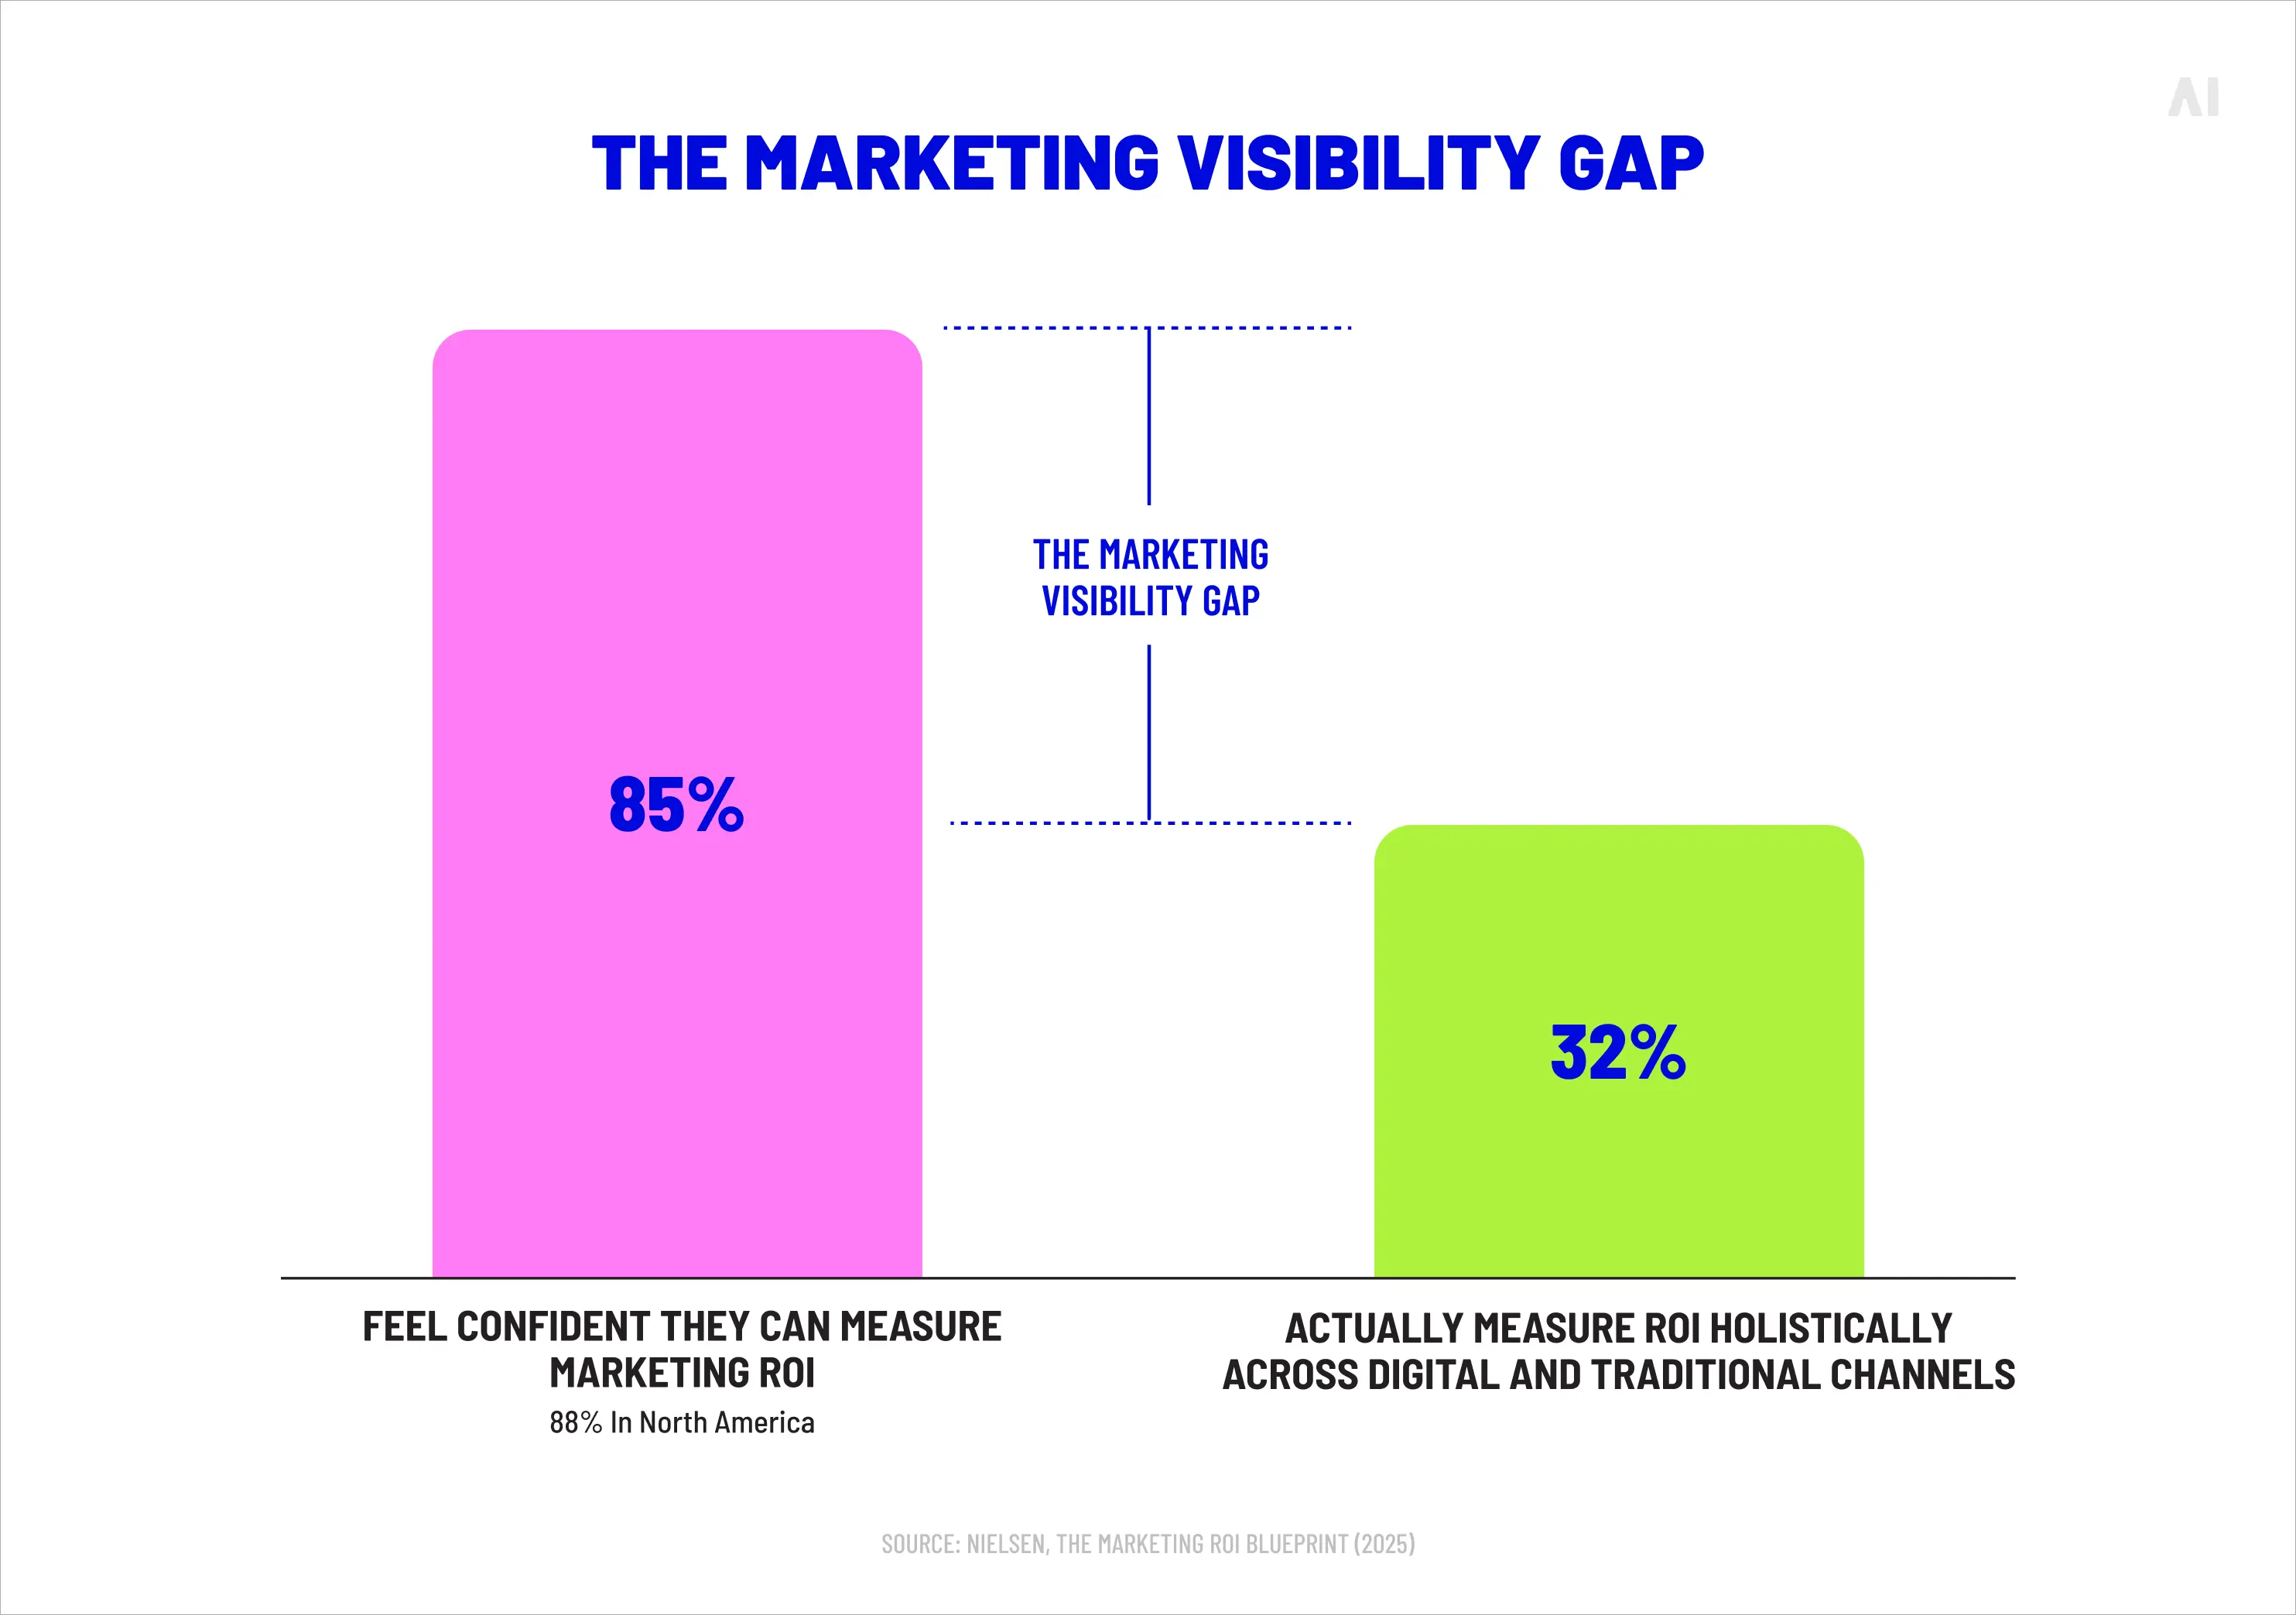
A strange gap sits at the heart of modern marketing. Nielsen's research found that 85% of marketers say they are confident in their ability to measure return on investment — and 88% in North America — while only 32% actually measure it holistically across traditional and digital channels. Confidence has run well ahead of capability, and the distance between the two is where marketing visibility either exists or quietly disappears.
The cause is not a shortage of information. Most teams are awash in it: dashboards from every platform, exports from every tool, reports refreshed by the hour. What goes missing is the connective understanding that turns all of that into a coherent account of how channels, campaigns, audiences, spend and outcomes relate to one another. Marketing visibility is that account — the ability to see not only what each part of the marketing ecosystem is doing, but how the parts add up. The sections that follow define it, explain why it has become so elusive, and set out what full marketing performance visibility looks like in practice when it is working as it should.
What is marketing visibility?
Marketing visibility is the ability to understand how every element of performance connects across channels, campaigns, audiences and budgets, and what is genuinely driving the outcomes. It reaches well past a tidy dashboard or a monthly report. Visibility takes in the performance drivers behind the numbers, the customer journeys that run between touchpoints, the way channels influence one another, and the business impact that follows. A team can hold a complete record of its activity and still lack visibility, because recording is not the same as understanding.
The distinction can sound academic until a budget review forces the question of which channel actually earned a result. At that point, the difference between data you can see and performance you can explain becomes the whole game.
Visibility vs reporting
Reporting tells you what happened; visibility tells you why. A report can show that paid social delivered 4,000 conversions last month. It rarely shows whether those conversions would have arrived anyway, which upper-funnel activity primed them, or what they cost in genuinely incremental terms. Marketing reporting is a necessary input to visibility, not a stand-in for it. The trouble starts when an organization treats a fuller stack of reports as proof of a fuller understanding.
Visibility vs measurement
Measurement produces the raw material; visibility makes it usable. Marketing measurement generates the signals—impressions, clicks, conversions, brand lift, incrementality — that describe what each channel did. Visibility is the interpretive layer that assembles those signals into one trustworthy view and lets a team act on it. Strong measurement paired with weak visibility leaves you holding accurate data that nobody can reconcile. The two have to travel together.
💡 Related reads: Unified Marketing Measurement: Why Attribution Alone No Longer Works | Digital Marketing Measurement Across Channels
Why marketing visibility has become harder
Marketing visibility has become harder because the number of places performance happens, and the number of systems recording it, have both grown faster than the connections between them. The data has multiplied; the wiring that would join it up has not kept pace.
Fragmented marketing stacks
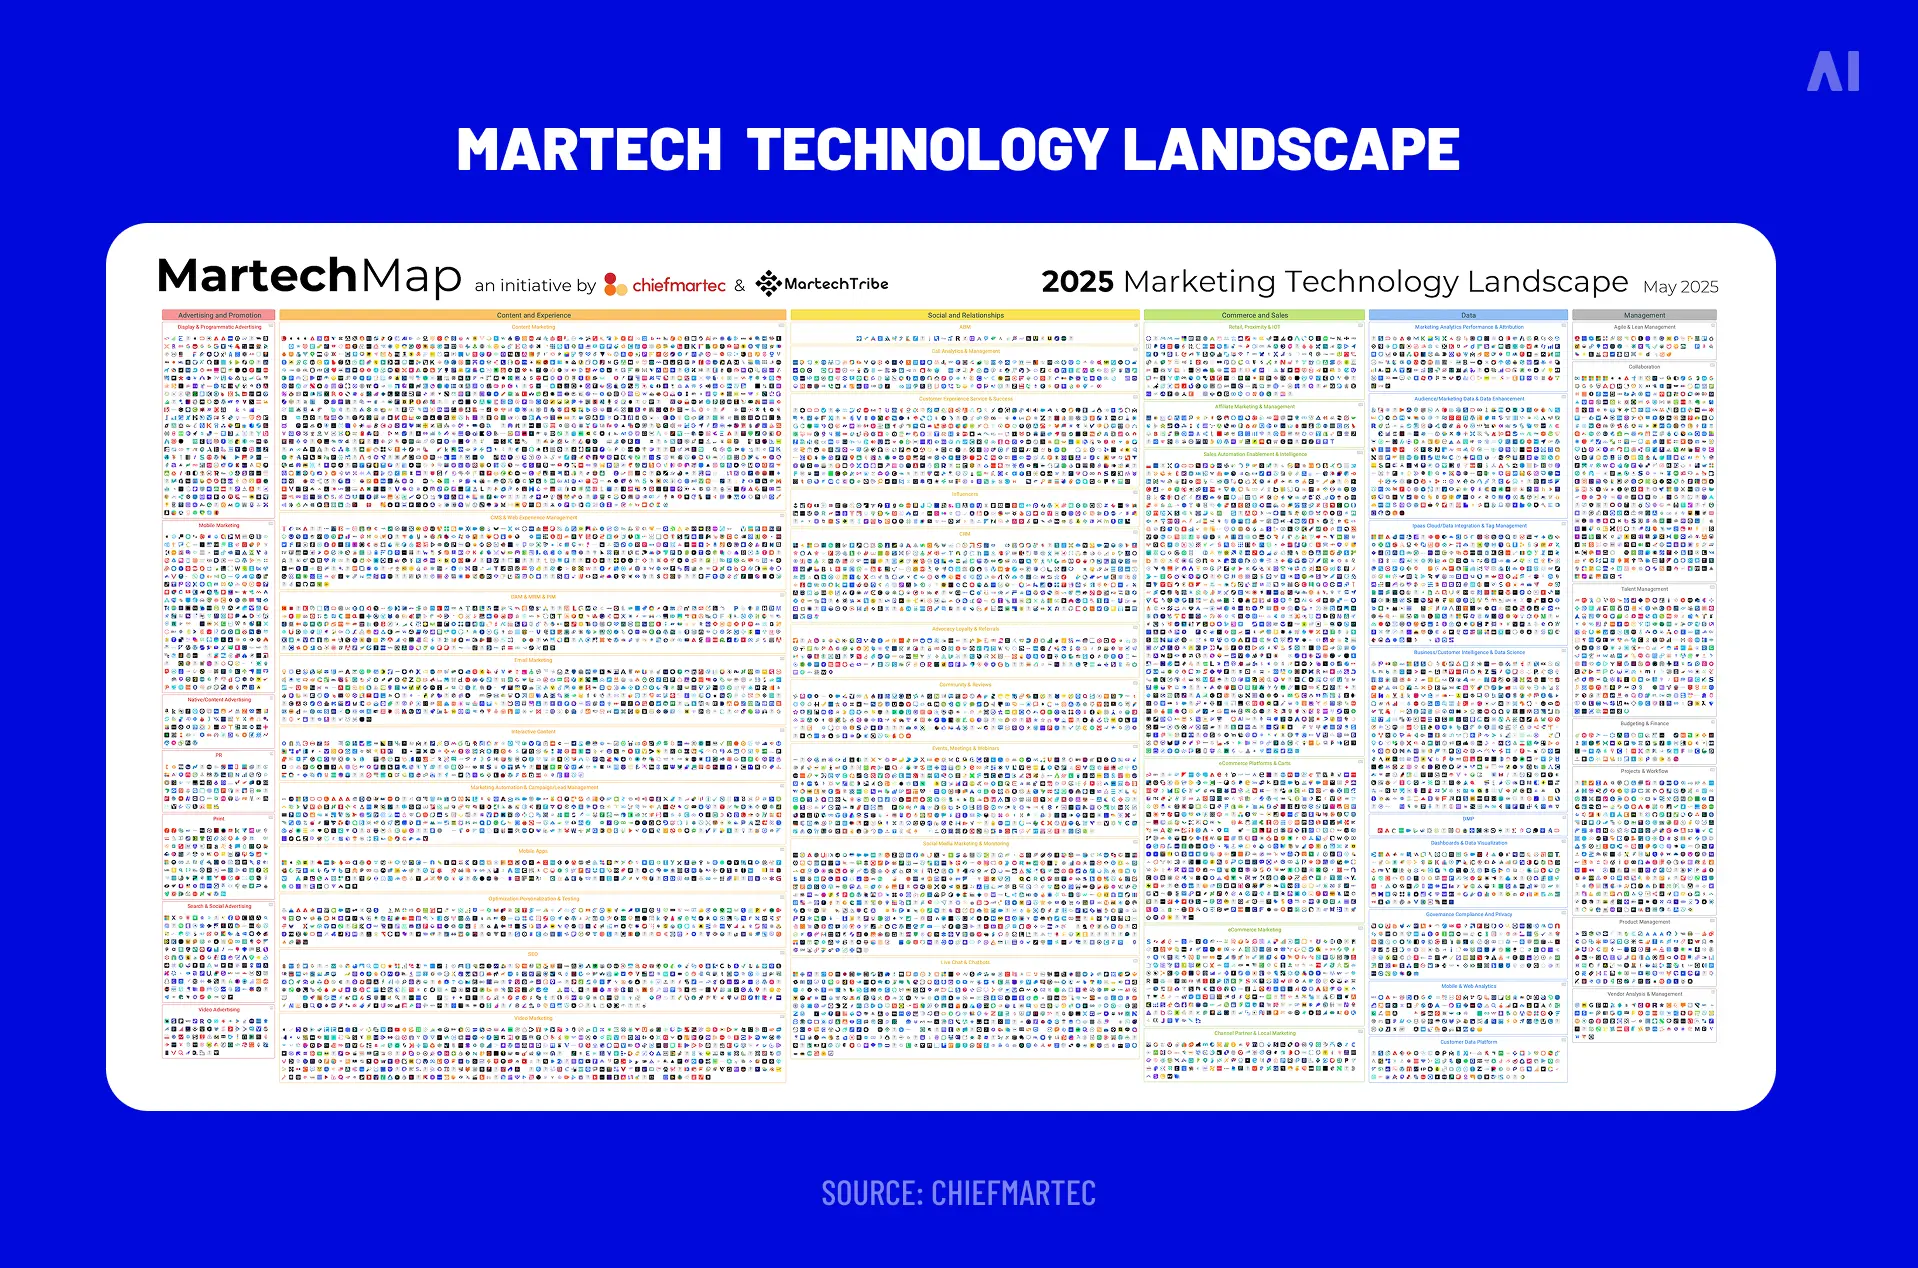
The clearest culprit is tool sprawl. The 2025 marketing technology census counted 15,384 tools, up 9% on the year before, spread across 49 categories. Most enterprise teams run dozens of these at once, each with its own data model, its own definitions and its own export. Every tool adopted in the name of insight becomes one more place where a version of the truth can drift from the others.
Platform-specific reporting silos
Each platform reports on its own activity, in its own terms, optimized toward its own objectives. Google measures Google, Meta measures Meta, and a retail media network measures itself. None is built to describe how its slice of spend interacted with the rest, which leaves cross-channel visibility as a gap by design rather than an oversight. Stitching those silos together falls to the marketer, usually by hand and usually too late to act on.
Privacy and signal loss
The familiar prophecy — that third-party cookies were about to vanish — proved wrong. Google reversed its deprecation plan in 2024, confirmed in April 2025 that it would not even add a cookie choice prompt to Chrome, and wound down its Privacy Sandbox project in October 2025. Cookies remain enabled by default in Chrome. Signal loss is real all the same: Safari and Firefox have blocked third-party cookies for years, consent requirements keep tightening, and users reject tracking more readily than they accept it. The data that reaches a marketing team is patchier and more governed than it was, and marketing data visibility increasingly has to be rebuilt on first-party foundations rather than borrowed identifiers.
Cross-channel customer journeys
Customers no longer move through marketing in straight lines. A single purchase might begin on connected TV, carry on through search, pause inside an email, and close on a marketplace days later. Few measurement setups follow that path end to end, so the journey breaks into platform-shaped pieces and the credit lands wherever the final click happened to fire. Without a connected view, the channels that did the early, unglamorous work go unrewarded, and the budget drifts toward whatever sits closest to the conversion.
💡 Related reads: Fragmented Martech Stacks Are Killing Marketing Performance | Marketing measurement vs attribution vs MMM: what's the difference.
The hidden cost of poor marketing visibility
Poor marketing visibility is expensive in ways that seldom appear as a line item. Nielsen's 2025 Annual Marketing Report traced the difficulty of proving cross-media ROI to problems with data, weak tools, too many vendors and a lack of transparency across newer channels such as retail media. Each of those is a tax on decision quality, paid quietly, month after month.
Budget allocation becomes guesswork
When a team cannot see how channels contribute to one another, it allocates on instinct and recent memory. Spend follows the channels that report well rather than the channels that perform well, and the two are not always the same. Last-click attribution flatters the bottom of the funnel and starves the top, so the activity that creates demand is cut first when budgets tighten — the precise opposite of what the evidence would advise.
Optimization opportunities are missed
Opportunities to improve performance hide in the connections between channels, which is exactly where fragmented reporting cannot look. A creative that lifts search interest, an audience that converts only after exposure on two platforms, a daypart that quietly outperforms — these patterns live across systems, not within them. If nobody can see across the systems, the patterns stay invisible and the gains stay unbanked.
Teams lose trust in data
Few things corrode a marketing function faster than two teams arriving at a meeting with two different numbers for the same campaign. Once finance, sales and marketing stop agreeing on what a conversion is or how revenue is credited, the data stops settling arguments and starts causing them. Decisions then retreat to seniority and conviction, and the analytics investment becomes theater.
Growth forecasting becomes unreliable
Foreсasting depends on understanding why past results occurred, not merely that they did. A team without that understanding can extrapolate a trend line but cannot explain it, which makes every forecast brittle. The first market change exposes the guesswork, plans are rewritten in a hurry, and credibility erodes with each revision.
⚡ Poor visibility seldom announces itself as missing data. It shows up as confident decisions made on a partial view, and those cost far more than the absence of a decision ever would.
What full visibility actually looks like
When marketing visibility is working, an organization can answer four questions without convening a task force: what each channel is contributing, how customers actually move between them, what business result follows, and what is likely to happen next. Each maps to a layer of understanding that a connected marketing ecosystem should make routine.

Visibility into channels and campaigns
The starting layer is an honest, comparable view of every channel and campaign in one place, measured against shared definitions. Comparable is the operative word: spend, reach and outcomes expressed in the same units, so that paid social and connected TV can sit in the same table without an asterisk explaining why they cannot be compared. This is the foundation of cross-channel visibility, and most other layers fail without it.
Visibility into customer journeys
Above the channel view sits the journey: the sequence of touches that carried a customer from first contact to conversion and beyond. Seeing the journey reveals which interactions assisted, which closed, and which were simply present at the finish. It is the difference between knowing that an email was opened and knowing what role that email played in a purchase three weeks later.
Visibility into business outcomes
Visibility earns its keep when it connects to revenue, margin and customer value rather than media metrics alone. Impressions and click-through rates describe activity; sales, retention and lifetime value describe consequence. A team with full visibility can trace a clear line from spend to business result, which is the line that a finance director actually wants drawn.
Visibility into future performance trends
The final layer looks forward. With connected historical data and sound modeling, a team can anticipate where performance is heading, which channels are saturating, and where the next increment of budget will work hardest. Visibility into future trends turns marketing analytics from a record of the past into a guide for the next quarter.
💡 Related reads: Why Cross-Platform Measurement Is Still Broken in a Walled Garden World | Marketing measurement framework: how to build a scalable system
The five pillars of marketing visibility
Complete marketing visibility rests on five components. Treat any one as optional and the picture develops a blind spot that the others cannot cover for.
Unified data collection
Everything begins with data that arrives in one place and behaves consistently once it does. That means first-party data captured cleanly, platform integrations that pull performance in automatically, CRM connections that tie marketing to revenue, and governance that keeps definitions stable as sources multiply. Without unified collection, every later step inherits the gaps.
Cross-channel measurement
Visibility requires measuring channels in relation to one another, not as a row of independent silos. Cross-platform measurement asks how display, search, social, connected TV and retail media combine to produce a result, and credits them accordingly. Measured in isolation, each channel can look like the hero of its own report while the truth lives in the overlaps.
Consistent reporting frameworks
A shared reporting framework gives every team the same KPIs, the same definitions and the same standards. When a conversion means the same thing to marketing, sales and finance, the numbers stop being negotiable and start being useful. Consistency is unglamorous work, and it is the difference between marketing reporting that aligns a business and reporting that divides it.
Forecasting and predictive intelligence
Mature visibility moves a team from describing what happened to anticipating what will. Forecasting and predictive intelligence draw on connected history to project reach, cost and conversion, and to flag where assumptions are about to break.
💡 Done well, it shapes planning before money is committed rather than explaining results after it is spent — a discipline explored further in AI Digital's work on retail forecasting.
Actionable decision support
The fifth pillar is the one most often forgotten: visibility should prompt action, not merely display information. Decision support translates the connected view into a recommended next move — reallocate here, pause that, test this — and puts it in front of the person who can act. Insight that no one acts on is a cost, not an asset.
⚡ The hardest part of visibility is rarely collecting more data. It is connecting the data already gathered into a single account of performance that a team can actually trust.
💡 Related reads: How AI platforms improve cross-channel marketing performance.
Why dashboards alone do not create visibility
It is tempting to assume that one more dashboard will finally deliver clarity. More often it adds another window onto the same fog. Dashboards are how data is displayed; visibility is whether anyone understands what the display means and what to do about it. The two can move in opposite directions.
Data visibility vs decision visibility
Data visibility is the ability to see numbers. Decision visibility is the ability to see what the numbers imply for the next choice. A team can have abundant marketing data visibility — every metric on screen, refreshed in real time — and almost no decision visibility, because nothing on the screen tells it which lever to pull. The point of seeing is doing, and a dashboard that stops at seeing has done only half the job.
Metric overload and reporting fatigue
Past a certain volume, more metrics reduce understanding rather than improve it. Faced with hundreds of numbers and no hierarchy among them, teams default to the few they recognize and ignore the rest, which often buries the very signal most worth seeing. Reporting fatigue is the quiet result: dashboards that everyone has access to and no one reads.
Why disconnected dashboards create confusion
Marketing dashboards that each draw from a different source, with different definitions, do not add up to a fuller view. They add up to several incompatible views that have to be argued over before anyone can act. Three dashboards showing three conversion totals do not triple confidence; they triple doubt. Disconnection at the data layer surfaces as confusion at the decision layer.
Turning data into actionable intelligence
The way out is not another screen but a connective layer that reconciles the sources, settles the definitions and surfaces the handful of insights that should change behavior. Turning data into actionable intelligence means deciding, on the team's behalf, what is worth looking at — and saying so plainly enough to prompt a decision.
💡 Related reads: Marketing dashboards: why data doesn't turn into decisions.
How AI improves marketing visibility
Artificial intelligence improves marketing visibility through scale and pattern recognition applied to data volumes no analyst could read by hand. The contribution is not mystical. AI reads across millions of rows, finds the relationships that connect them, and brings the important ones to the surface for a person to judge. Used well, it widens the field of view while leaving the decision with the human who is accountable for it.
Automated insights
The first gain is sheer coverage. AI can scan every channel, segment and creative continuously, flagging anomalies and movements that a weekly manual review would miss entirely. Instead of a team sampling its data, the data is read in full and the exceptions are escalated, which is a more reliable way to keep marketing performance visibility current.
Predictive forecasting
AI sharpens the forward view. By learning from connected historical performance, models can project conversion, cost and reach with more nuance than a trend line, and update those projections as fresh data lands. The forecast becomes a living estimate rather than a quarterly set piece, which is far more useful when conditions move.
Cross-channel analysis
Cross-channel effects are precisely the patterns AI is good at finding, because they hide in interactions across large datasets rather than in any single report. A model can detect that a display campaign lifts branded search, or that an audience converts only after exposure on two platforms, and quantify the relationship so a planner can act on it.
Opportunity identification
Beyond describing what is, AI points toward what could be: an underfunded segment, a saturating channel, a creative worth scaling. By comparing performance against patterns it has seen across many campaigns, it can suggest where the next increment of effort is likely to pay off, turning marketing intelligence into a source of concrete recommendations rather than retrospective commentary.
💡 Related reads: Types of AI marketing platforms Automation, Analytics, Personalization, and Performance | Why AI alone can't fix marketing performance
Building visibility across your marketing ecosystem
Improving visibility is less a purchase than a sequence of disciplines, each of which makes the next one possible. The order is worth respecting: skip a step and the later ones wobble.

Connect data sources
Begin by bringing the sources together. Integrate the platforms, the CRM, the analytics and the offline data into a common environment so that performance can be read in one place rather than reassembled from a dozen exports. Connection is the precondition for everything else; an organization cannot align what it cannot see side by side.
Standardize measurement frameworks
Next, agree on how things are counted. Standardize the definitions, the KPIs and the attribution approach so that every team measures the same event the same way. This is the work that prevents the meeting-room standoff over conflicting numbers, and it pays back every time a decision rests on a figure that no longer needs defending.
Align reporting with business goals
Reporting should answer the questions the business is actually asking — about revenue, efficiency and growth — rather than cataloguing every metric a platform happens to emit. Aligning marketing reporting with business goals keeps attention on the outcomes that justify the budget and quietly retires the vanity metrics that fill space without informing anything.
Create a unified source of intelligence
With sources connected and definitions agreed, consolidate them into a single, trusted view that the whole organization can work from. Progress here is uneven: in one recent benchmark, only about half of organizations reported having a single source of truth for sales and marketing data — a B2B-weighted figure, but a fair indication that the other half are still reconciling by hand. A unified source is what turns connected data into shared understanding.
Continuously validate performance assumptions
Finally, treat visibility as a habit rather than a project. Assumptions that held last year — which channel drives demand, which audience converts, how long a journey takes — drift as the market moves. Validating them on a regular cadence keeps the picture honest and stops a stale belief from quietly steering the budget for months.
The role of marketing intelligence platforms
A marketing intelligence platform is the layer that does the connecting an organization keeps wishing would happen on its own. Sitting above the individual tools, it unifies the data, reconciles the definitions, and provides the single view from which planning, optimization and reporting can all draw. Where a single platform reports only on itself, a marketing intelligence platform is built to report across everything.
Unifying performance data
The first job is unification: pulling performance from every channel and system into one consistent model so that comparison is possible and reconciliation stops being a manual chore. This is the connective tissue that the five pillars assume and that fragmented stacks rarely provide on their own.
Improving decision-making
With data unified, the platform can move from description to direction — surfacing the insights that should change behavior and putting them where decisions are made. Better decision-making is the point of the exercise; a marketing intelligence platform that merely centralizes reporting without sharpening choices has automated the symptom rather than treating the cause.
Supporting forecasting and planning
A capable platform connects what happened to what is likely to happen, feeding connected history into forecasts and plans. Planning then begins from evidence rather than from last year's spreadsheet, and scenarios can be tested before money is committed instead of explained after it is spent.
Connecting planning, optimization and reporting
The deepest value comes from closing the loop, so that planning, live optimization and post-campaign reporting all run off the same intelligence rather than three disconnected systems. AI Digital's platform, Elevate, was built around exactly this. A vendor-agnostic marketing intelligence platform, it brings research, planning, optimization and reporting into one layer across the full digital ecosystem — drawing on more than 150 billion data points a month and over 10,000 audience attributes, spanning 12-plus demand-side platforms, and extending to marketing mix modeling and path-to-conversion analysis that credit every touch rather than only the last. Its guiding idea is access: instead of gating clients out of the system, Elevate puts them inside it, with a direct view of how their spend connects to measurable business results rather than media metrics alone.
💡 Related reads: Marketing planning software: how to connect planning, optimization and reporting
Visibility in open vs closed marketing ecosystems
How much a marketer can see depends heavily on where they are looking. The architecture of the environment — open or closed — sets the ceiling on visibility before any tool is brought to bear.
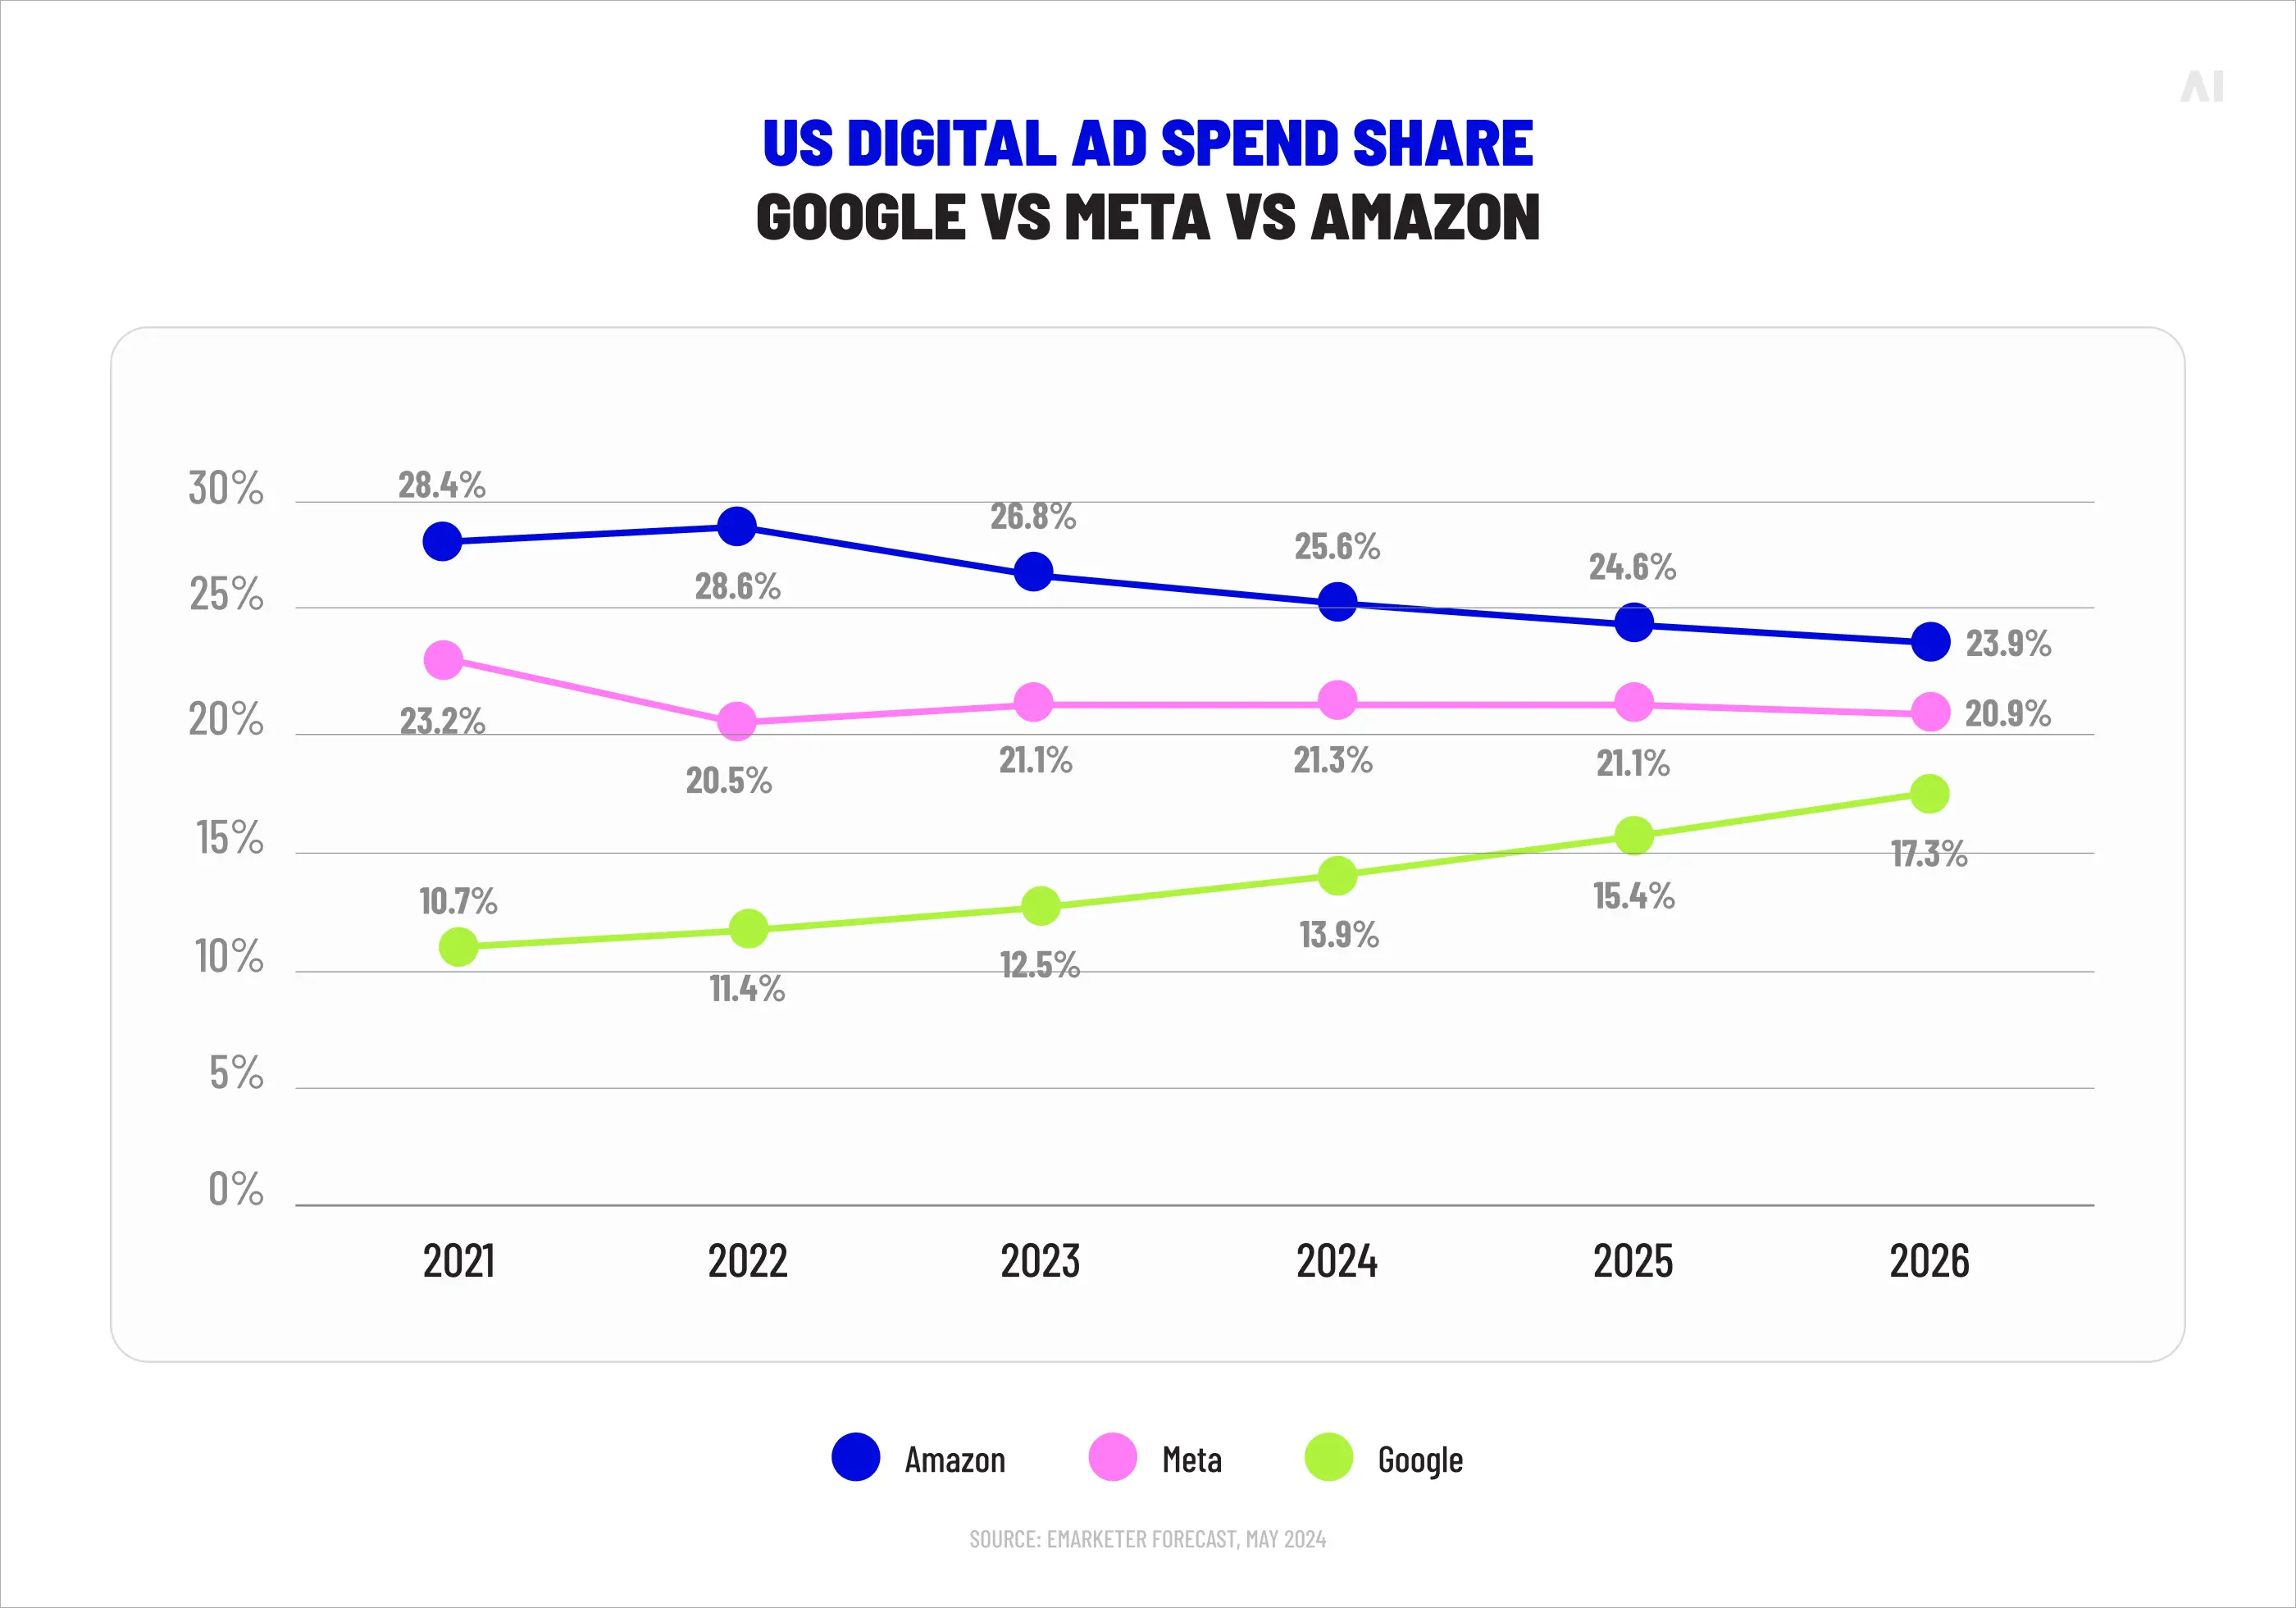
Walled gardens and visibility limitations
Closed platforms keep their data, audiences, inventory and measurement inside their own perimeter, and report on performance in terms they define. The scale and targeting are genuine, but the visibility is bounded: an advertiser sees what the platform chooses to show and little of how that activity related to anything outside the wall.
💡 AI Digital examines this dynamic in detail in its piece on walled gardens.
Interoperability challenges
Even a team committed to a connected view runs into the practical friction of joining systems that were never designed to cooperate. Mismatched identifiers, incompatible definitions and guarded data exports all make interoperability harder than it should be. Much of the labor of visibility is simply the work of forcing systems to speak to one another.
Open ecosystems and transparency
Open environments invert the trade-off. They offer transparency into where spend goes, how inventory is priced and how audiences are reached, which is the raw condition for genuine cross-platform measurement. The argument for transparency in advertising is, at root, an argument for visibility: you cannot understand what you are not permitted to see.
Why marketers increasingly seek independent visibility
This is why more advertisers want a view of performance that no single platform controls. Independent visibility lets a team evaluate every channel on common terms rather than accepting each platform's account of its own success.
💡 It is the thinking behind AI Digital's Open Garden framework — a model for reading performance across closed and open environments alike, explained further in what the Open Garden framework is.
⚡ Every closed platform reports on its own performance, in its own terms. Independent visibility begins where a single platform's account of itself ends.
Common mistakes that reduce marketing visibility
Most visibility problems are self-inflicted, and they tend to show up as a recognizable set of habits. Spotting them early is cheaper than diagnosing them after a bad quarter.
Tracking channels separately
The most common error is treating each channel as its own world, with its own report and its own success story. Measured separately, channels cannot reveal how they assist one another, and the connective effects that drive real performance never appear. Separate tracking guarantees a fragmented view, however good each individual report is.
Using inconsistent KPIs
When teams define the same metric differently, the numbers stop being comparable and start being contested. Inconsistent KPIs are the root of most data disputes, and they make any unified view impossible until they are reconciled. Agreeing a shared set of digital marketing KPIs is among the highest-return, lowest-cost moves available to a marketing function.
Prioritizing reports over decisions
Some organizations measure their analytics maturity by the number of reports they produce, which rewards activity over usefulness. A library of reports that no one acts on is a sunk cost dressed as rigor. The better test is whether the reporting changed a decision; if it never does, the volume is the problem, not the solution.
Treating visibility as a reporting problem
Visibility is often handed to whoever owns reporting, as though a better dashboard would settle it. The real obstacles are usually organizational — disconnected data, misaligned definitions, no shared source of truth — and no amount of reporting can fix a problem that lives upstream of the report. Treated as a reporting task, visibility stalls.
Relying entirely on platform reporting
Leaning solely on each platform's own numbers means accepting each platform's framing of its own value. Native reporting is useful, but it is rarely neutral and never cross-channel, so a team that relies on it alone inherits a structurally incomplete view. Independent measurement is what keeps any one platform from grading its own homework.
Gain complete visibility into marketing performance
Sustainable growth depends on understanding how channels, campaigns, audiences, budgets and business outcomes connect across the whole marketing ecosystem — not on owning more screens. True marketing visibility comes from connected data, consistent measurement, predictive intelligence and decision-focused reporting working together, rather than from a wall of isolated dashboards each telling part of a story. The teams that achieve it spend less time reconciling numbers and more time acting on them, and they make fewer confident decisions that later prove to have been built on a partial view.
That connective layer is what AI Digital builds. Through its Open Garden framework, its managed media service and curation, and its Elevate marketing intelligence platform, AI Digital helps brands and agencies bring research, planning, optimization and reporting into a single view across the full digital ecosystem. If your team is working to replace fragmented reporting with clear, independent visibility into what actually drives performance, it is worth a conversation — you can get in touch with AI Digital to explore where to start.